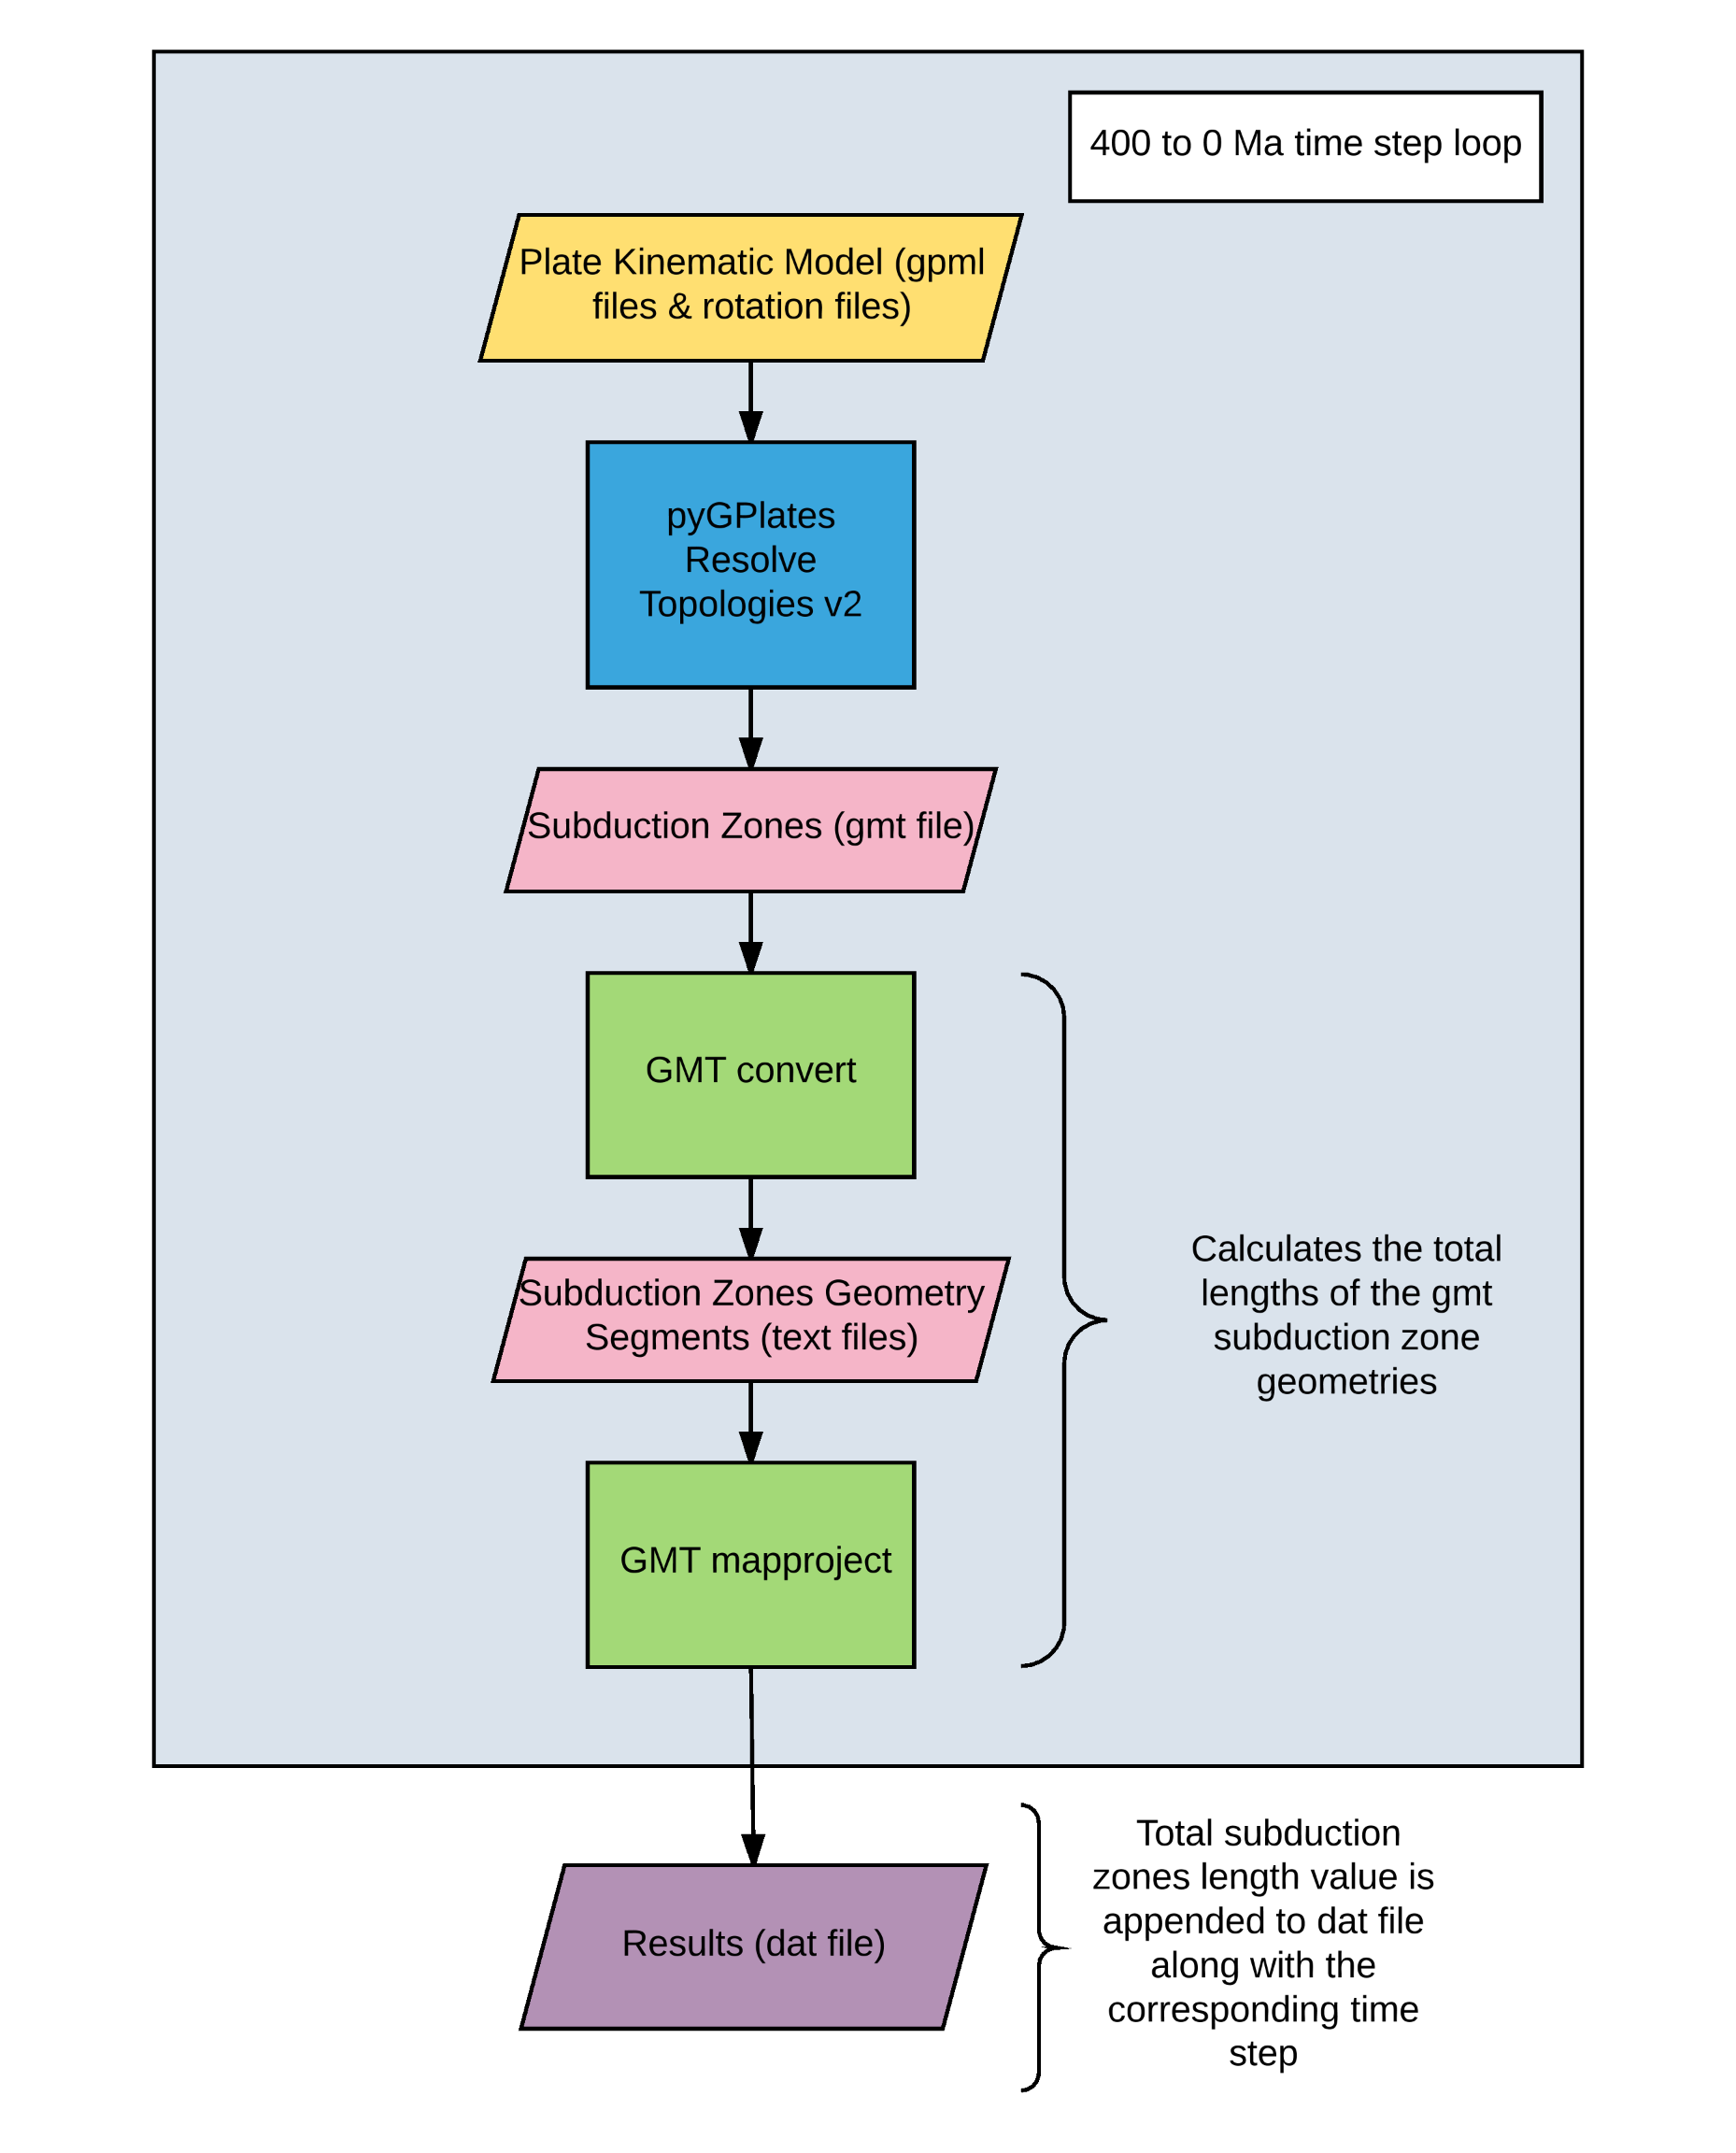
For our first analysis, we developed a simple work flow to quantify subduction zone lengths from 0 to 400 Ma, using the Matthews et al. (2016) plate kinematic model. The bash workflow consists of python scripts, GMT tools and AWK scripts organised into bash sub-routine functions.
The most integral parts of the workflow are the python scripts which communicate with GPlates using the pyGPlates module. For this workflow, we needed to extract all subduction zone geometries at each time step from 400 to 0 Ma. For any given plate kinematic model, GPlates can resolve the plate tectonic boundaries per time step.
We reworked a pyGPlates script to produce one called ‘resolve_topologies_v.2.py’. The script will produce all plate tectonic boundaries in gmt file format categorised by type, including mid ocean ridge (MOR), transform and subduction zone boundaries. Subduction zone boundaries are produced with left polarity, right polarity and a file that combines both. The significance of polarity relates to the direction in which the subduction zone was digitised when the plate model was created, and on what side of the boundary the subduction teeth point when looking in the direction of digitisation. Note that one can specify the files created by this script to be either in shp, xyz or gmt format.
With these gmt files depicting total subduction zones we were able to calculate their total lengths using tools from GMT 5 (Generic Mapping Tools release 5.2.1). The measured length of global subduction zones is simply appended to a dat file with its corresponding time step. We use a 400 loop iterator to repeat this process for each 1 million year time step. See the flowchart below for a schematic representation of this process.

The graph below depicts total subduction (red) and atmospheric CO2 (blue) from 0 to 400 Ma. This atmospheric CO2 proxy record was taken from Royer (2006) which locally weighted a compilation of CO2 proxy data to produce a regression curve. Notably from 80 to 0 Ma, a correlation of peaks exist between levels of atmospheric CO2 and total subduction zone lengths. 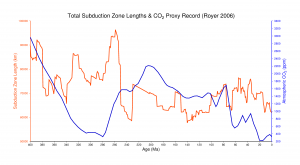
![]()
