How significant is the crustal carbon reservoir?
The incorporation of CO2 in oceanic crust and carbon-rich seafloor sediments facilitates the removal of carbon in the world’s oceans. At subduction zones, CO2 is recycled in the mantle. Our interest in modelling the CO2 flux budget between the oceanic crust and the mantle is to investigate the long-term balance between CO2 sources and CO2 sinks.
![Present-day spatio-temporal distribution of Seafloor Age [Myr] (top), predicted CO2 content [wt. %] of oceanic crust (middle) and seafloor sediment thickness [metres] (bottom) in Mollweide projection. Raster images were produced using GPlates 1.5 with color scales produced in GMT.](https://www.earthbyte.org/wp-content/uploads/2016/08/lowres_time-dependent-rasters.jpg)
Figure 1. Present-day distribution of Seafloor Age [Myr] (top), predicted CO2 content [wt. %] of oceanic crust (middle) and seafloor sediment thickness [metres] (bottom) in Mollweide projection. Raster images were produced using GPlates 1.5 with colour scales produced in GMT.
Average age of oceanic crust
Age grids of the oceanic crust from 230 Ma have been created by Müller et al. (2016), and are available online here. The animation* below shows the age of oceanic crust through time, where red colours indicate young crust progressively maturing to blue.
CO2 content of upper oceanic crust
The CO2 content of the upper oceanic crust gets progressively enriched by hydrothermal alteration with age and with distance from mid-ocean ridges (MORs). This process has been demonstrated to contribute significantly to the removal of carbon in the deep carbon cycle.
Jarrard (2003) interpreted a correlative relationship to predict the subduction flux of CO2 based on the average CO2 content of upper oceanic crust from drill cores from specific Ocean Drilling Project (ODP) sites. The crustal CO2 content grids are based on these empirical relationships.
The animation* below shows the CO2 content of oceanic crust through time, where deep blue colours indicate a low CO2 content of crust at spreading ridges (~0.045 wt.%) which gets progressively enriched to a high CO2 content (light green).
Seafloor sediment thickness
Like CO2 content, the thickness of sediment cover on the seafloor is also a function of oceanic crustal age and depth. Sediment cover is largely comprised of the biogenic production of inorganic carbon in the form of calcium carbonate (CaCO3) and organic carbon in the form of methane (CH4), which is partly converted by sedimentary microbes to carbon dioxide (CO2). Thus, the thickness of sediment cover on the seafloor is an indicator of the abundance of carbon being consumed at subduction zones. The animation* below shows the seafloor sediment cover thickening through time, where deep blue colours indicate thin sediment cover, thickening toward light green.
Results
We quantified and visualised the carbon flux at subduction zones as heat maps as they relate to the upper oceanic crustal properties of crustal age, CO2 content and sediment thickness through time from 230 to 0 Ma (below).
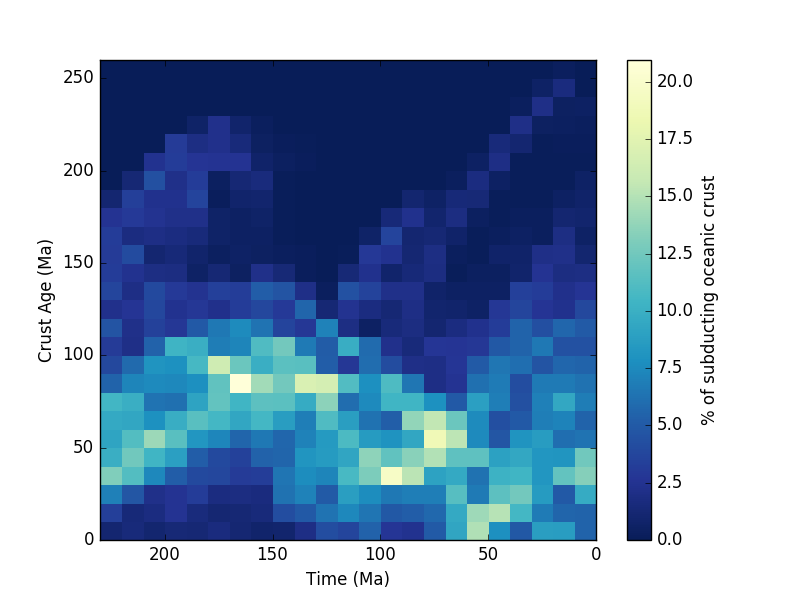
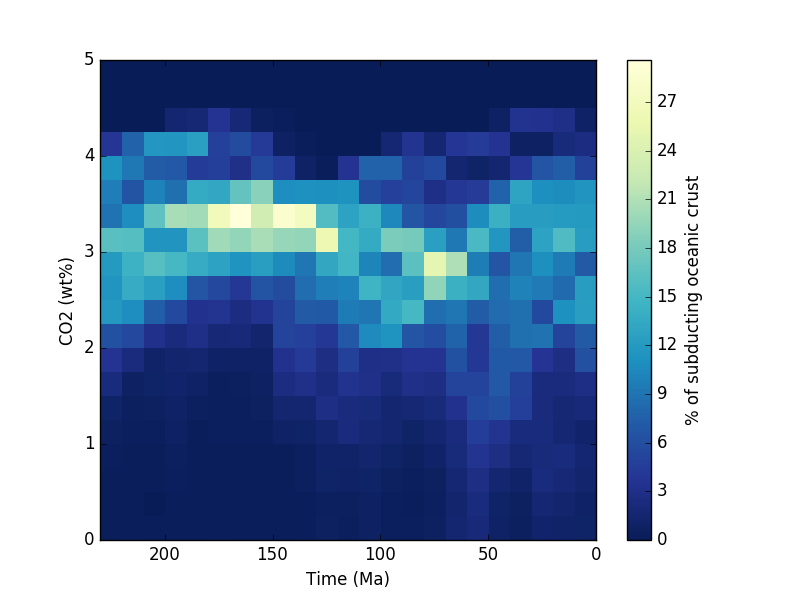
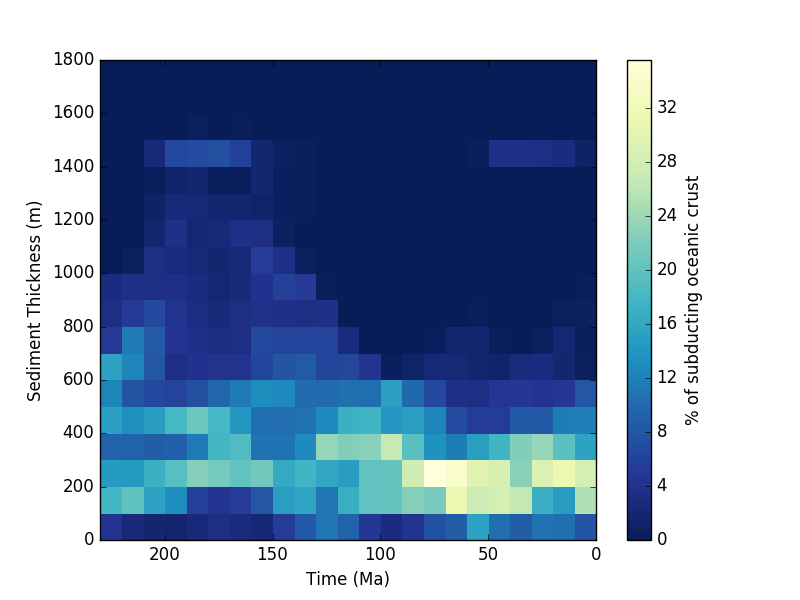
The initiation of supercontinent break-up around 170 Ma likely controlled the subduction of progressively younger crust with lower CO2 content and thinner sediment cover (Figure 2, 3).
The relatively large subduction flux of the upper crustal properties of mean age, CO2 content and sediment cover is in broad agreement with the levels of palaeoatmospheric CO2 in proxy and modelled data between 230 and 190 Ma (Figure 3) with notable periods of divergence for all upper crustal properties between approximately 190 and 150 Ma. The CO2 proxy record (Royer 2006) predicted oscillating cycles in atmospheric CO2 levels that trend toward a regional peak at 80 Ma, which is relatively well-matched by the subduction flux of CO2-enriched oceanic crust (Figure 4).
A divergence between palaoatmospheric CO2 indicators and mean crustal age and mean CO2 content in the most recent past from 30 Ma to present day is also evident (Figure 3). This indicates how other atmospheric, hydrologic and geologic climatic feedback systems may have dominated during these times.
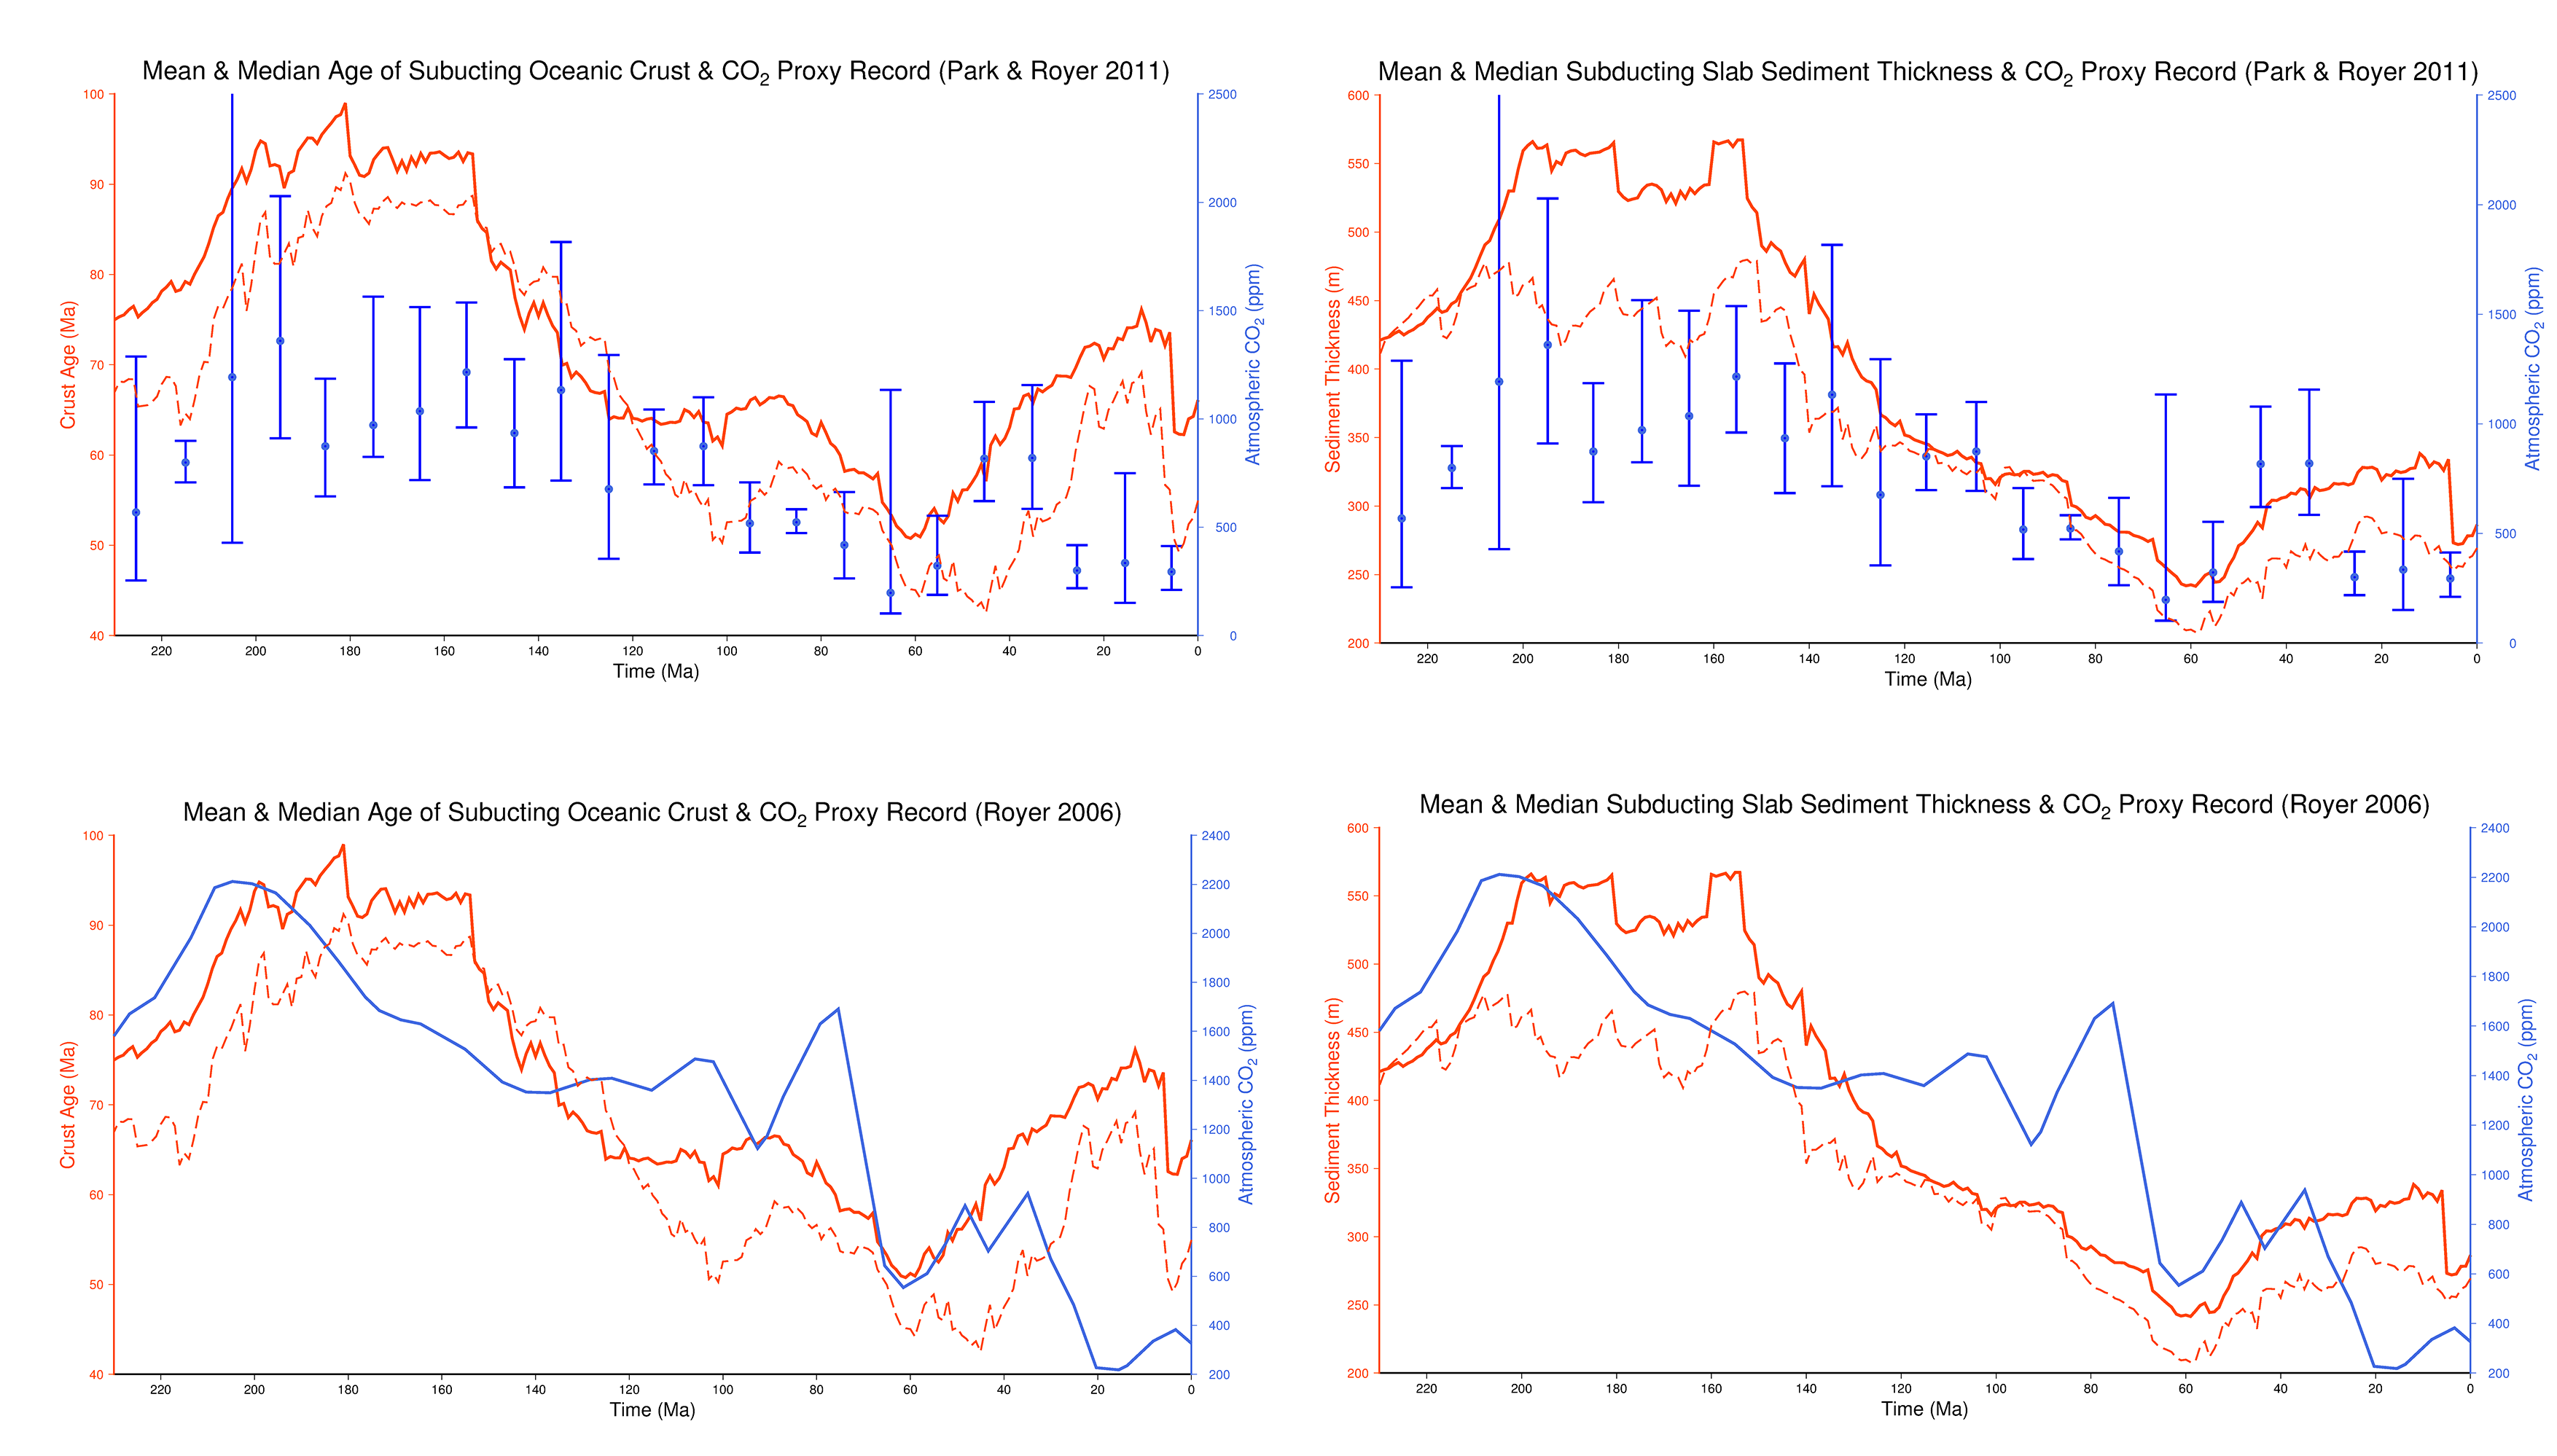
Figure 3. The mean (red, solid) and median (red, dashed) values for age and sediment thickness of the subducting oceanic crust measured at subduction zones in 1 Myr intervals, based on the Müller et al. (2016) plate model. The blue curve represents the atmospheric CO2 (ppm) from smoother CO2 proxy data (Royer 2006) and the error bars represent a compiled, updated CO2 proxy record (Royer and Park 2011).
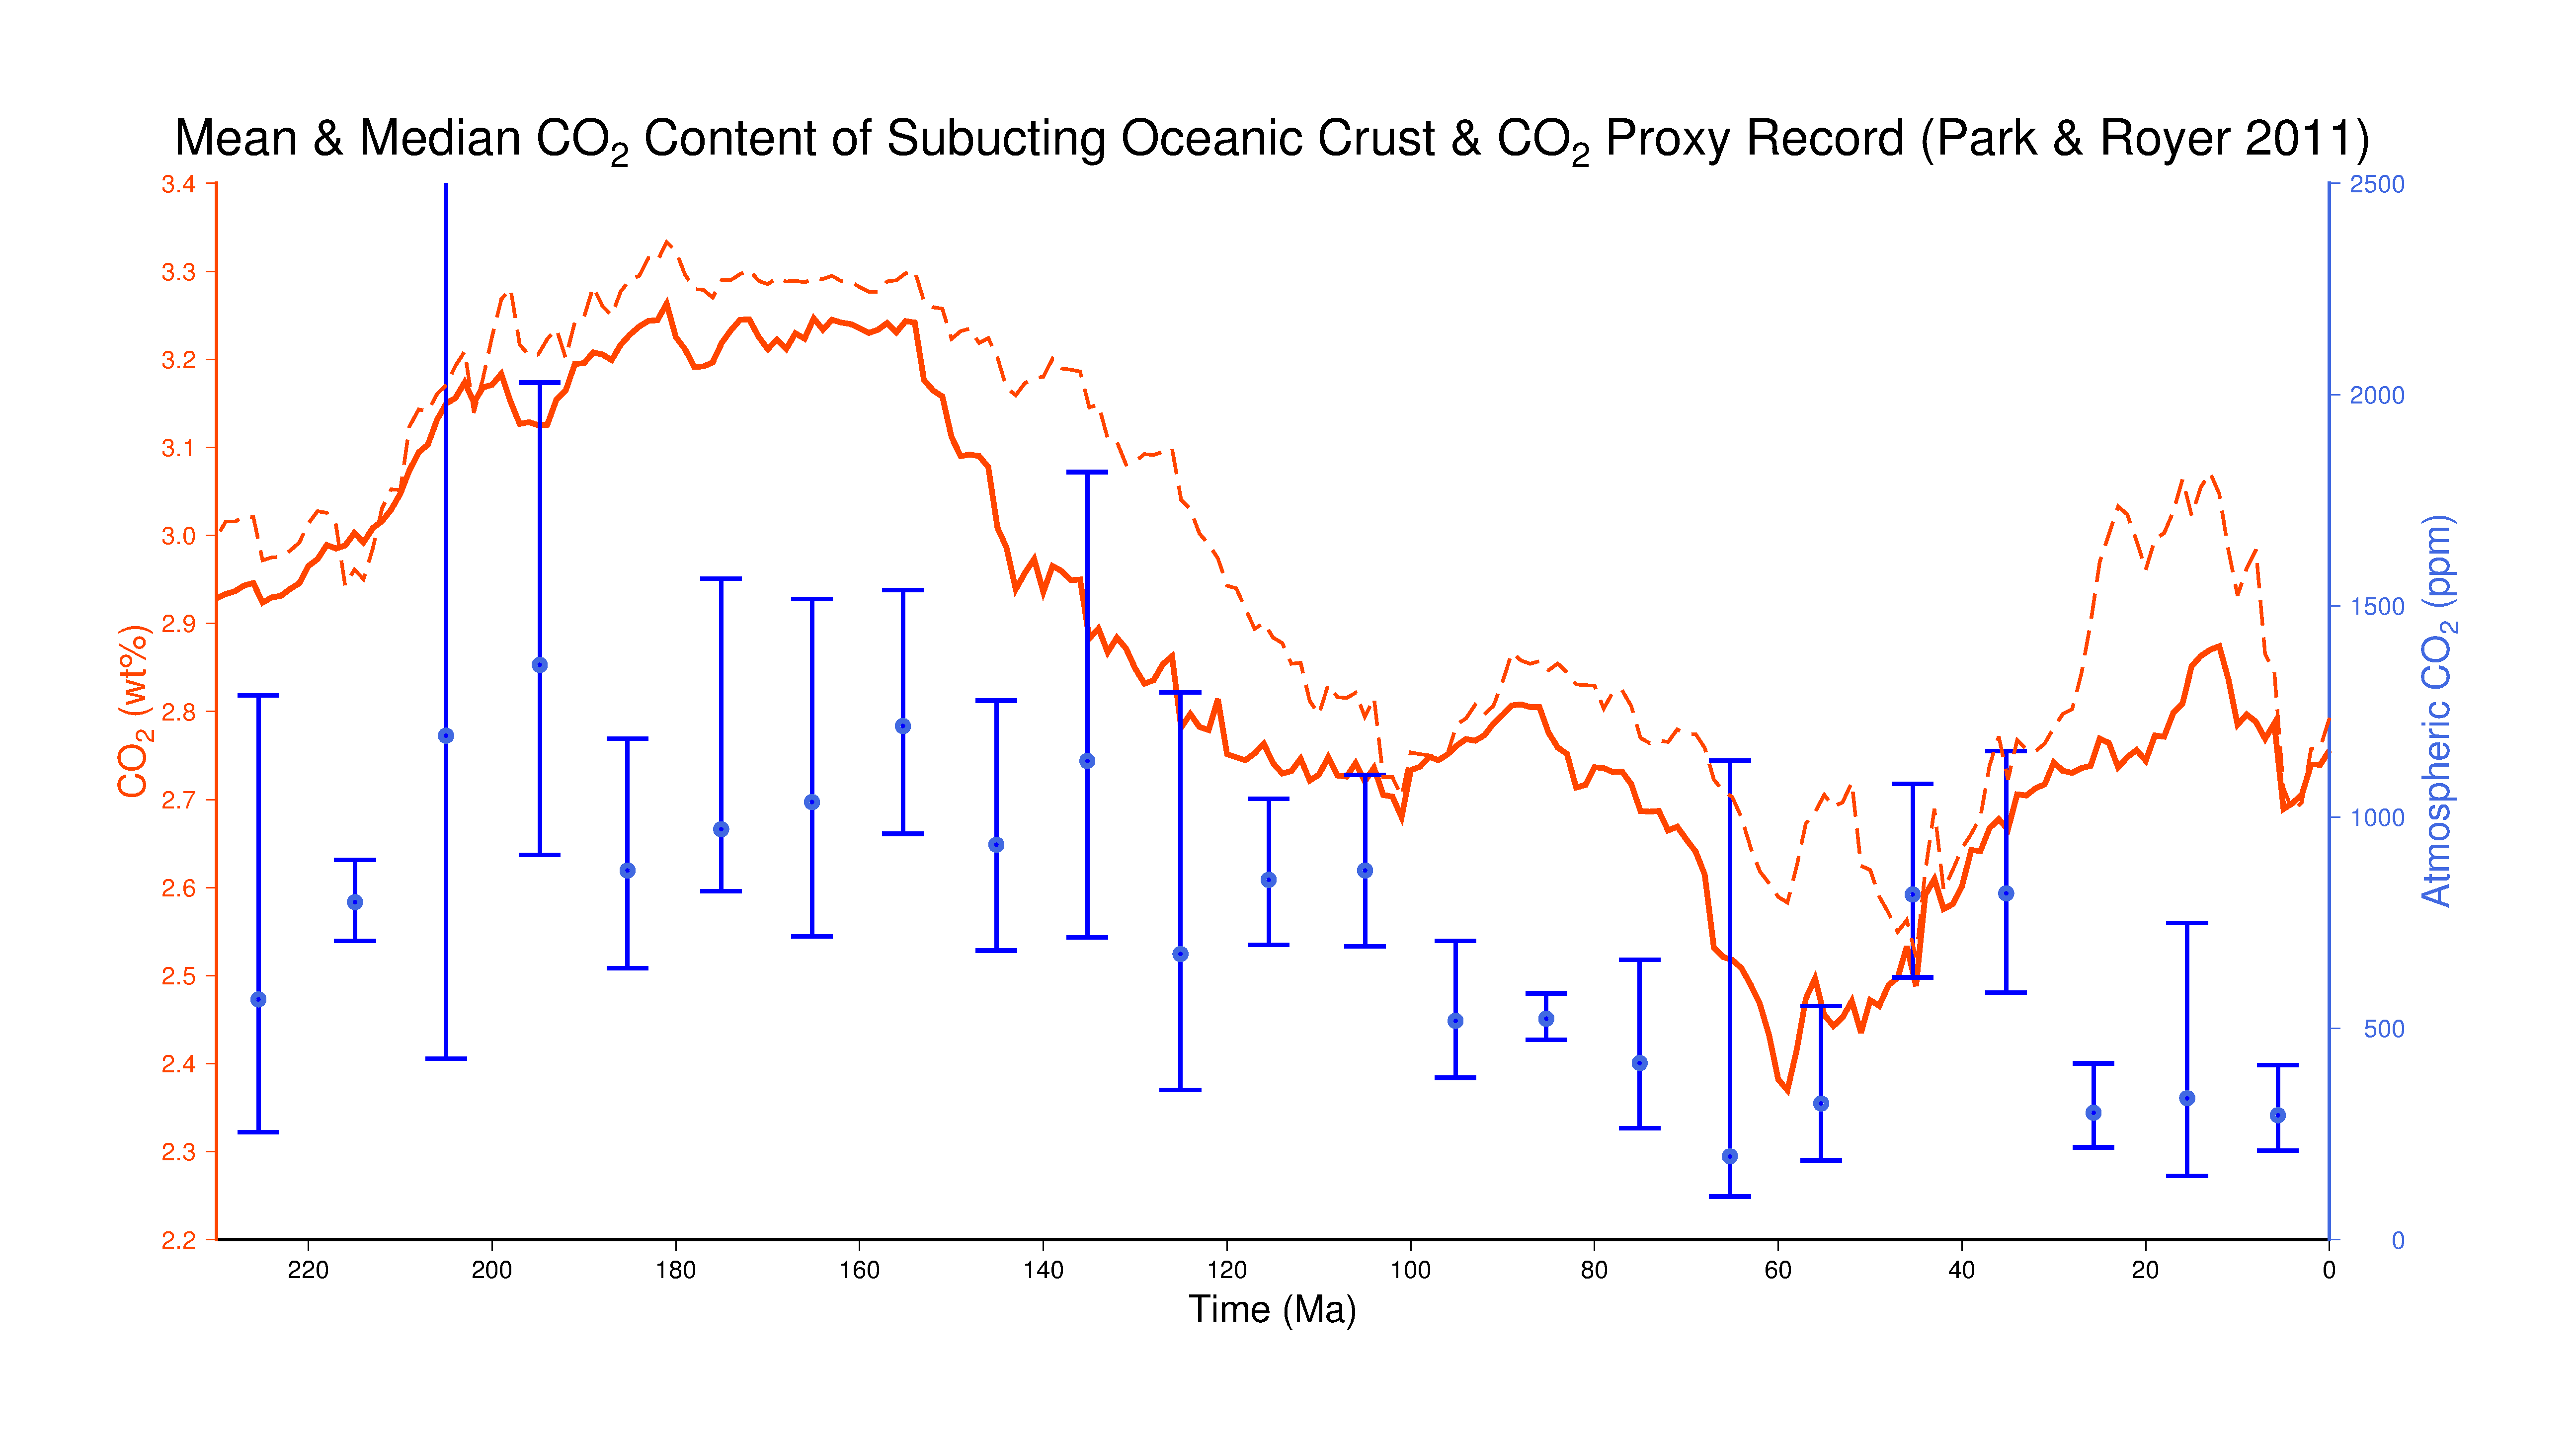
Figure 4. The mean (red, solid) and median (red, dashed) values for CO2 content of the upper oceanic crust.
* All animations were created using GPlates by exporting snapshots at each 1 Myr interval and stitching them together using the open-source video editing code, ffmpeg.
![]()
