This virtual globe was developed using data from the paper cited below.
Juan Carlos Afonso, Farshad Salajegheh, Wolfgang Szwillus, Jorg Ebbing, Carmen Gaina, A global reference model of the lithosphere and upper mantle from joint inversion and analysis of multiple data sets, Geophysical Journal International, Volume 217, Issue 3, June 2019, Pages 1602-1628, https://doi.org/10.1093/gji/ggz094
The original data used to create this 3D globe are provided in CSV text format and can be downloaded from the EarthByte website: Afonso_etal_GJI_2019_LithoRef18.xyz.
The four(4) NetCDF files listed below were generated from the data inside the file Afonso_etal_GJI_2019_LithoRef18.xyz using GMT Surface and scipy.interpolate.griddata().
-
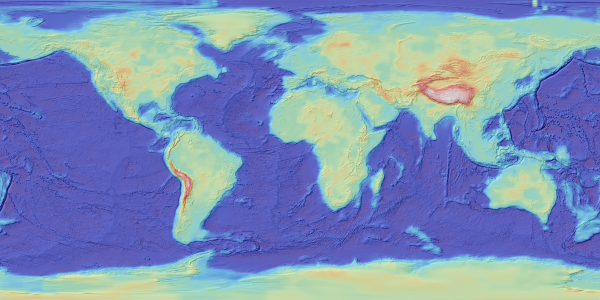
crustal-thickness-gmt-surface.nc
(1800x900)
The crustal-thickness-gmt-surface.nc file was created by subtracting the ELEVATION values (column 3) from the MOHO values (column 4), i.e., MOHO - ELEVATION. The raw data was then interpolated by "gmt surface" to produce a regular grid. Please note that the GMT surface command can produce smoother grids than scipy.interpolate.griddata() when using nearest-neighbor interpolation; however, it may also introduce artifacts.
-
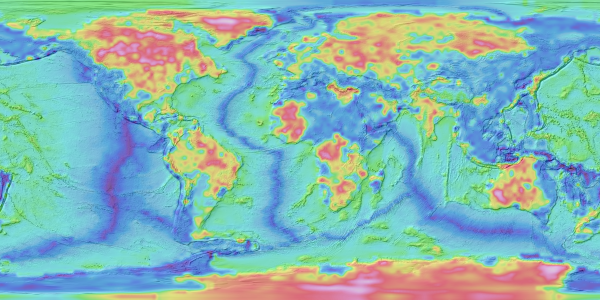
lithospheric-thickness-gmt-surface.nc
(1800x900)
The lithospheric-thickness-gmt-surface.nc file was created by subtracting the ELEVATION values (column 3) from the LAB values (column 5), i.e., LAB - ELEVATION. The raw data was then interpolated by "gmt surface" to produce a regular grid. Please note that the GMT surface command can produce smoother grids than scipy.interpolate.griddata() when using nearest-neighbor interpolation; however, it may also introduce artifacts.
-
crustal-thickness-griddata.nc
(1800x900)
The crustal-thickness-griddata.nc file was created by subtracting the ELEVATION values (column 3) from the MOHO values (column 4), i.e., MOHO - ELEVATION. The raw data was then interpolated by scipy.interpolate.griddata() using the Nearest Neighbour algorithm to produce a regular grid. Although the grid produced by the griddata() method is less smooth than that produced by GMT surface, the resulting grid values are more accurate.
-
lithospheric-thickness-griddata.nc
(1800x900)
The lithospheric-thickness-griddata.nc file was created by subtracting the ELEVATION values (column 3) from the LAB values (column 5), i.e., LAB - ELEVATION. The raw data was then interpolated by scipy.interpolate.griddata() using the Nearest Neighbour algorithm to produce a regular grid. Although the grid produced by the griddata() method is less smooth than that produced by GMT surface, the resulting grid values are more accurate.
The two(2) images shown below were used to create the 3D globe. The grids were generated using GMT surface. The crustal thickness grid is colored using the GMT Haxby color palette, while the lithospheric thickness grid uses the GMT Wysiwyg color palette. And the hillshading has been applied to both grids to enhance the topographic features.