ICONS basin atlas: Australia

The ICONS basin atlas is a collection of basin data for selected regions of the globe, displaying crustal structure data, computed extension factors and tectonic subsidence grids and derivatives thereof as well as the dynamic topography evolution of a given basin.

Regional overview page

This page bundles the available data for the Australia region. The images are hyperlinks and will open up a separate window with a high resolution PDF image of the map.

Regional basin list

To view the data for individual basins, select a basin from the dropdown menu below or click the basin name in the overview table. This will open a separate page with detailed maps.

ID Basin name Diff. β (rim)
(median)
Diff. β (rim)
(median)
Anom. TTS (rim)
(median) [km]
Anom. TTS (rim)
(max.) [km]
Sed. thickness
(median) [km]
Sed. thickness
(max) [km]
8160 Drummond Basin 0.07 0.19 0.52 1.13 2.56 3.44
8060 Georgina Basin -0.03 0.25 -0.21 2.21 0.54 2.53
8070 Amadeus-Pedirka Basins 0.15 0.26 1.04 1.75 0.79 1.26
8120 Bancannia Trough 0.1 0.14 0.72 0.96 0.28 1.19
8110 Saint Vincent Basin 0.27 0.76 1.44 2.48 0.2 1.3
8050 Lander Trough -0.01 0.16 -0.06 1.37 0.19 0.33
8190 Spencer Embayment 0.46 1.3 2.42 3.53 1.05 4.38
8020 Amadeus Basin 0.08 0.4 0.62 3.28 1.74 7.1
8030 Ngalia Basin 0.19 0.36 1.23 2.76 2.53 3.57
8150 Bowen Basin 0.17 0.31 1.12 1.77 1.31 5.23
8140 Gunnedah Basin -0.01 0.04 -0.11 0.26 0.42 0.92
8180 Troubridge Basin 0.57 0.63 3.0 4.01 0.47 4.9
8230 Burke River Graben 0.17 0.21 1.12 1.72 0.44 1.35
8310 Surat Basin 0.06 0.21 0.44 1.24 0.88 5.14
8320 Galilee-Drummond Basins 0.18 0.34 1.19 1.75 2.64 3.33
8010 Canning Basin 0.27 9.63 1.57 3.66 3.57 11.49
8130 Darling Depression 0.12 0.18 0.85 1.38 2.51 3.59
8360 Wiso Basin -0.07 0.14 -0.54 1.22 0.46 0.64
8080 Eromanga Basin 0.07 0.31 0.47 2.0 1.59 4.56
8300 Murray Basin 0.09 1.26 0.57 3.31 1.22 4.82
8220 South Nicholson Basin -0.1 0.06 -0.78 0.57 0.57 0.61
8330 Officer Basin 0.03 0.35 0.25 2.13 2.24 4.98
↑ back to the top
Dynamic topography for basin centroids

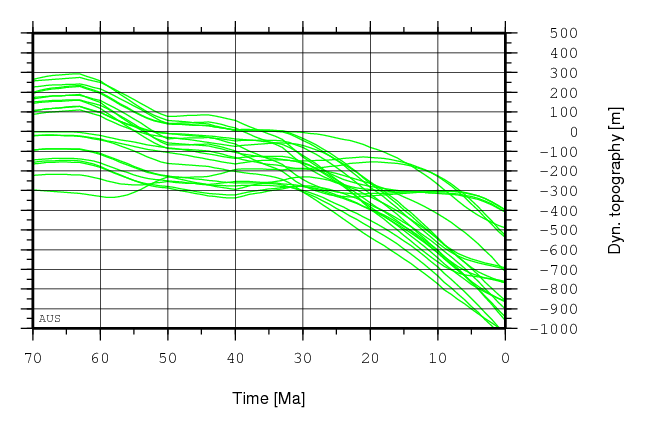
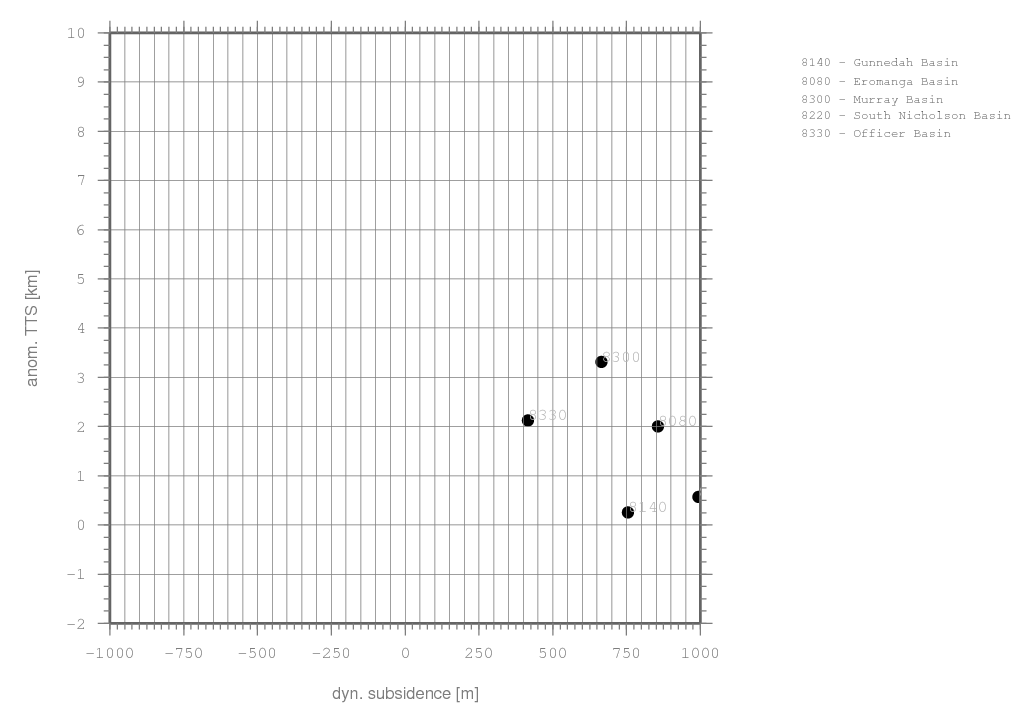
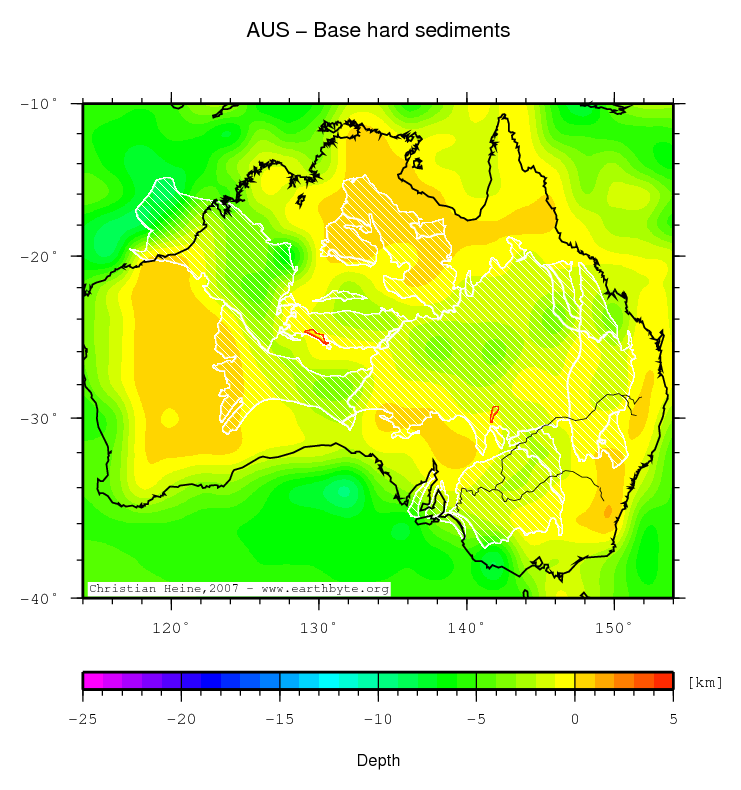
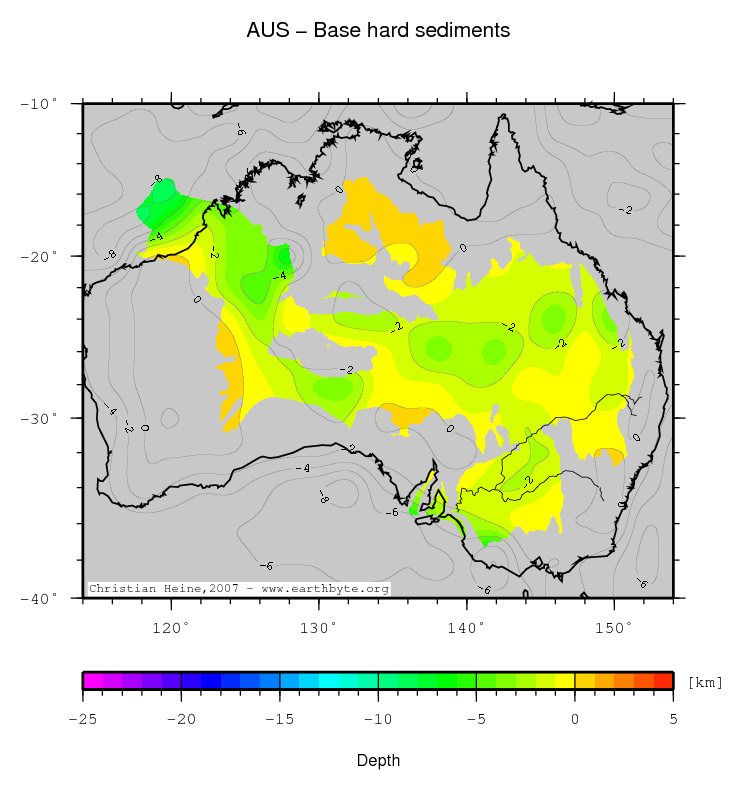
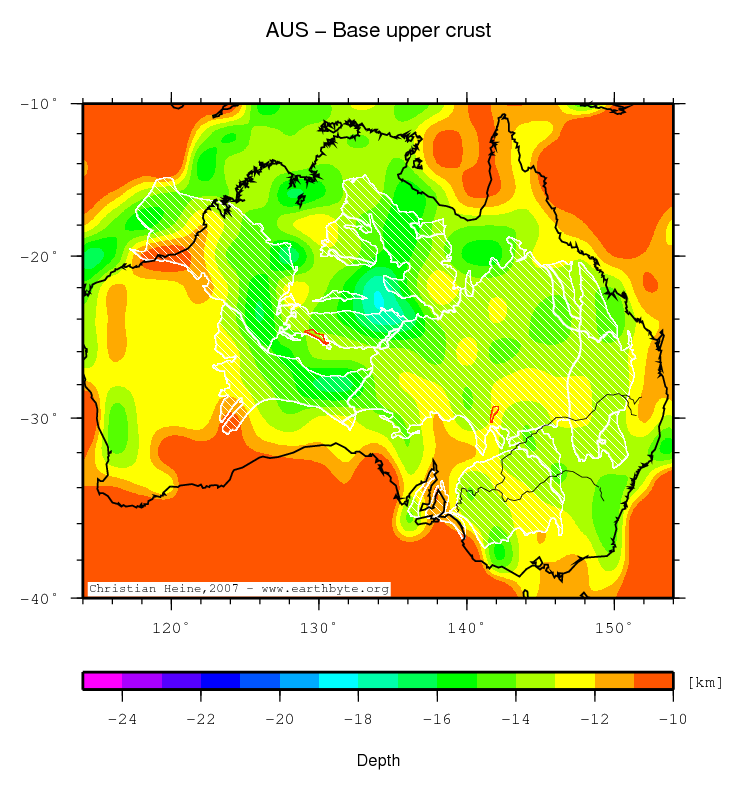
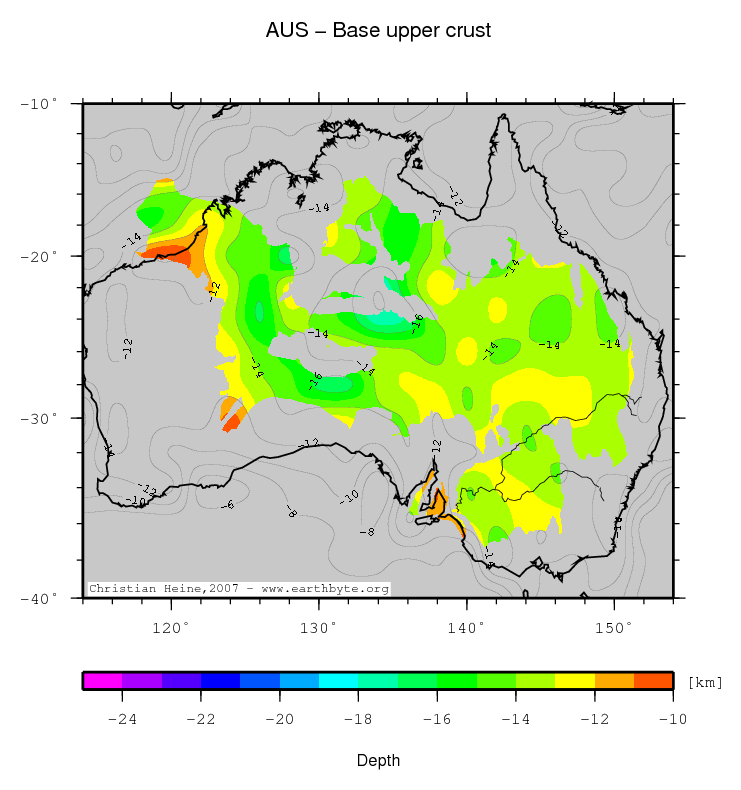
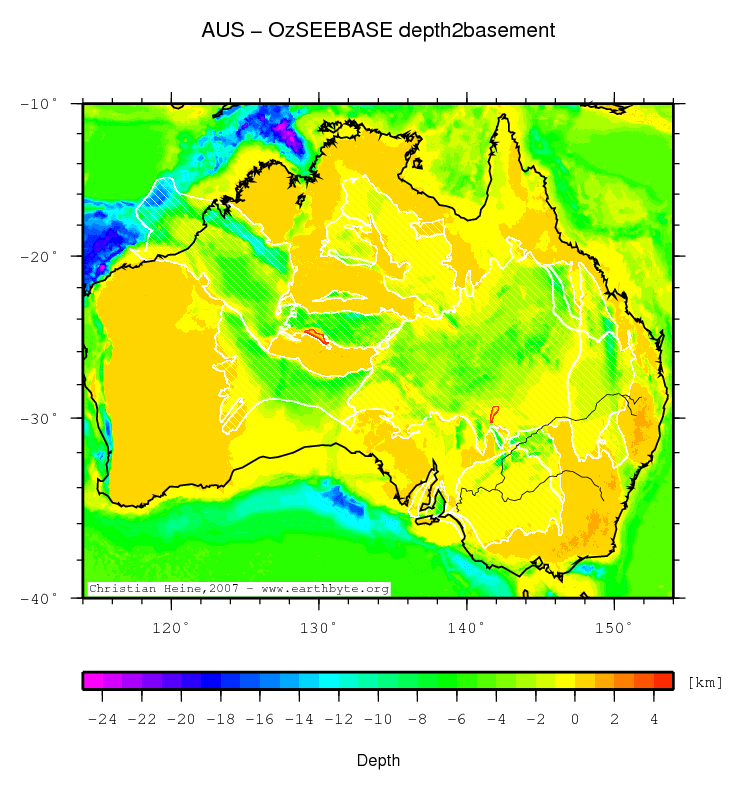
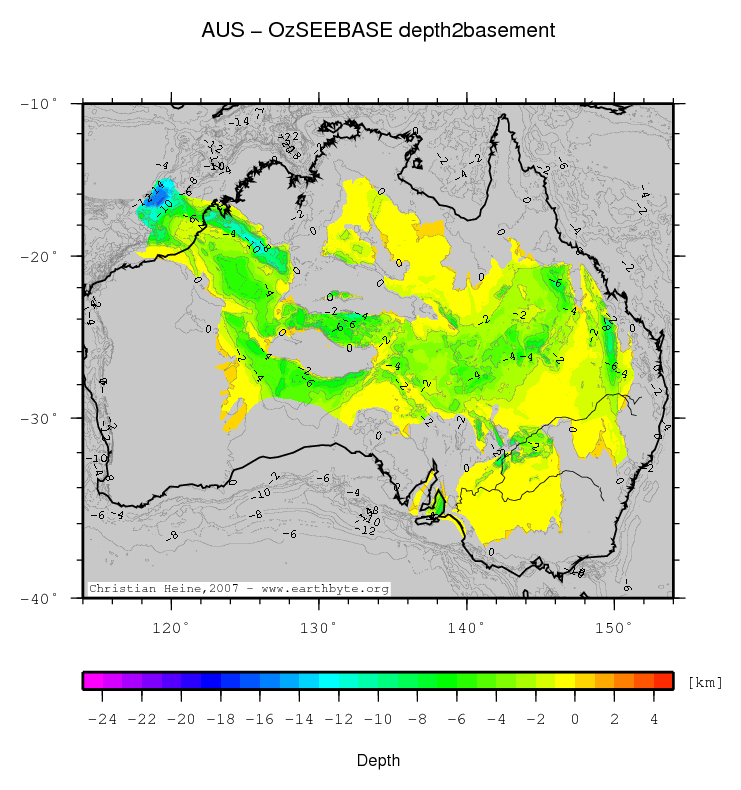
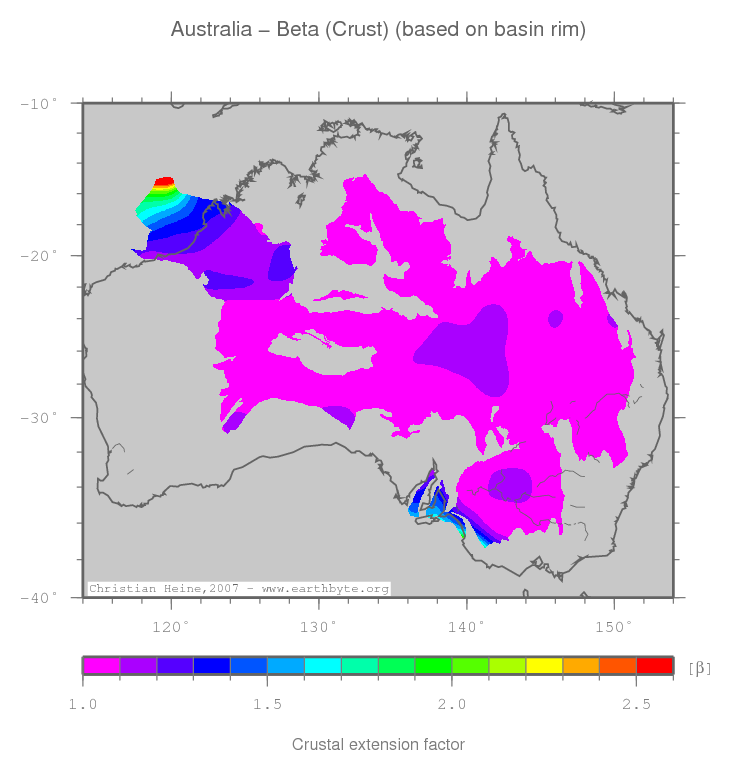
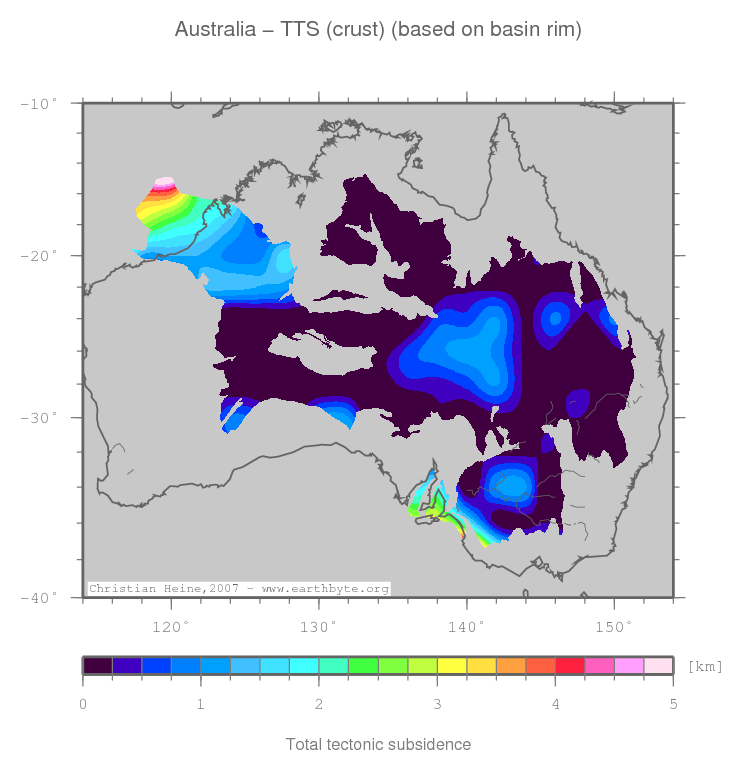
The dynamic topography history for the different basins is derived by tracking the basin centroid for any given basin in a region. The paleo-location for the basin centroid is computed using the EarthByte plate kinematic framework.

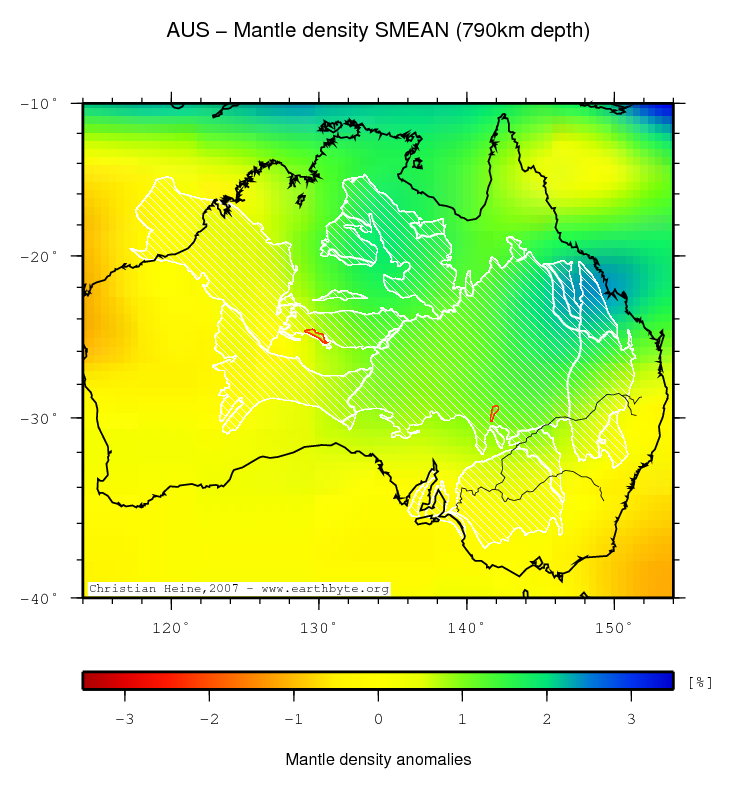
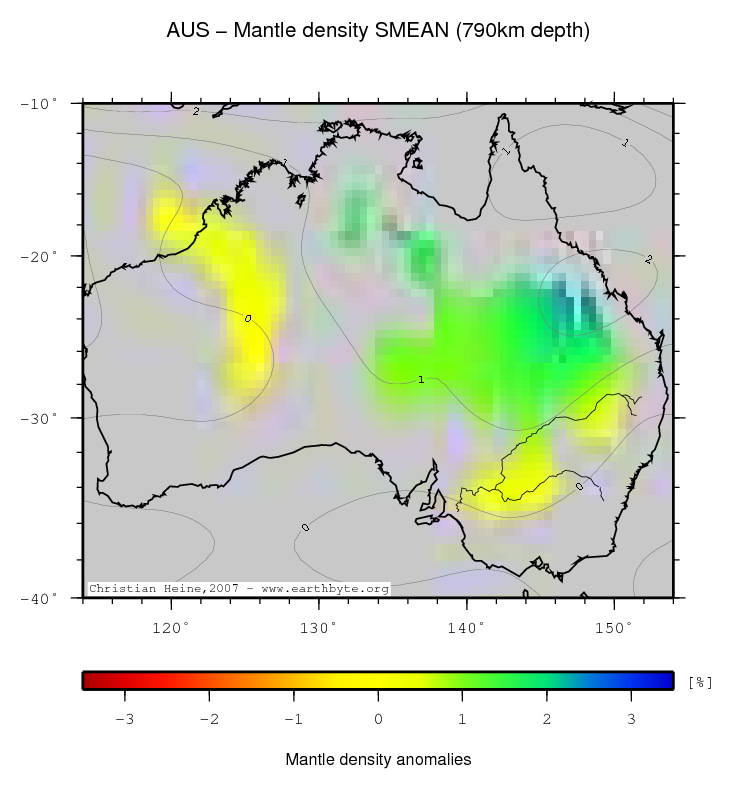
The dynamic topography model is derived from the S20RTS seismic tomography model (Ritsema et al., 99) by converting seismic velocites to density anomalies using an empirical scaling factor of 0.25. The density anomalies are then advected back in time to compute mantle flow with plate motions superimposed (using the EarthByte plate rotation framework) as surface boundary conditions. The dynamic topography is then derived from the computed density distribution using a free upper boundary. For details regarding the methodology see the following papers:

  • B. Steinberger, H. Schmeling, and G. Marquart. Large-scale lithospheric stress field and topography induced by global mantle circulation. Earth Planet. Sci. Lett., 186:75-91, 2001.
    doi: 10.1016/S0012-821X(01)00229-1.
  • B. Steinberger. Effects of latent heat release at phase boundaries on flow in the Earth's mantle, phase boundary topography and dynamic topography at the Earth's surface. Phys. Earth Planet. Int., 164:2-20, 2007.
    doi: 10.1016/j.pepi.2007.04.021.

No image available
↑ back to the top
Dynamic topography vs. anomalous tectonic subsidence
There is no grid with 2m resolution for this region available

Comments

This plot show the amount of total dynamic topography for the last 70 Ma plotted versus the computed anomalous tectonic subsidence for any given basin in this region. The basins are identified by their basin ID (a four-digit number), this number is used as unique identifier throughout this study.

The dynamic topography model is the same as used in the dynamic topography evolution of the basin. For the computation of anomalous tectonic subsidence, please refer to Thesis Chapter 4 and compare the anomalous tectonic subsidence maps for the individual basins and the region.

↑ back to the top

Observations

Topography (ETOPO2)
There is no grid with 2m resolution for this region available There is no grid with 2m resolution for this region available

Comments

For explanation to the data source or computation of this grid please follow this link. Clicking the image will open a high-res PDF of the map. Units in the statistics table are same as map units. Z_min and Z_max refer to the minima and maxima with their respective geographic locations.

↑ back to the top
Heatflow
There is no grid with 2m resolution for this region available There is no grid with 2m resolution for this region available

Comments

For explanation to the data source or computation of this grid please follow this link. Clicking the image will open a high-res PDF of the map. Units in the statistics table are same as map units. Z_min and Z_max refer to the minima and maxima with their respective geographic locations.

↑ back to the top
Mantle density SMEAN (500km depth)
There is no grid with 2m resolution for this region available There is no grid with 2m resolution for this region available

Comments

For explanation to the data source or computation of this grid please follow this link. Clicking the image will open a high-res PDF of the map. Units in the statistics table are same as map units. Z_min and Z_max refer to the minima and maxima with their respective geographic locations.

↑ back to the top
Mantle density SMEAN (790km depth)
There is no grid with 2m resolution for this region available There is no grid with 2m resolution for this region available

Comments

For explanation to the data source or computation of this grid please follow this link. Clicking the image will open a high-res PDF of the map. Units in the statistics table are same as map units. Z_min and Z_max refer to the minima and maxima with their respective geographic locations.

↑ back to the top
Mobil isopachs
There is no grid with 2m resolution for this region available

Comments

For explanation to the data source or computation of this grid please follow this link. Clicking the image will open a high-res PDF of the map. Units in the statistics table are same as map units. Z_min and Z_max refer to the minima and maxima with their respective geographic locations.

↑ back to the top
Sediment thickness (Australia, GA)
There is no grid with 2m resolution for this region available

Comments

For explanation to the data source or computation of this grid please follow this link. Clicking the image will open a high-res PDF of the map. Units in the statistics table are same as map units. Z_min and Z_max refer to the minima and maxima with their respective geographic locations.

↑ back to the top
GA crustal thickness
There is no grid with 2m resolution for this region available

Comments

For explanation to the data source or computation of this grid please follow this link. Clicking the image will open a high-res PDF of the map. Units in the statistics table are same as map units. Z_min and Z_max refer to the minima and maxima with their respective geographic locations.

↑ back to the top
Thermal lithospheric thickness
There is no grid with 2m resolution for this region available

Comments

For explanation to the data source or computation of this grid please follow this link. Clicking the image will open a high-res PDF of the map. Units in the statistics table are same as map units. Z_min and Z_max refer to the minima and maxima with their respective geographic locations.

↑ back to the top
Depth of 550 deg isotherm
There is no grid with 2m resolution for this region available

Comments

For explanation to the data source or computation of this grid please follow this link. Clicking the image will open a high-res PDF of the map. Units in the statistics table are same as map units. Z_min and Z_max refer to the minima and maxima with their respective geographic locations.

↑ back to the top
Lithospheric temperature gradient
There is no grid with 2m resolution for this region available

Comments

For explanation to the data source or computation of this grid please follow this link. Clicking the image will open a high-res PDF of the map. Units in the statistics table are same as map units. Z_min and Z_max refer to the minima and maxima with their respective geographic locations.

↑ back to the top
Temperature at 50km depth
There is no grid with 2m resolution for this region available

Comments

For explanation to the data source or computation of this grid please follow this link. Clicking the image will open a high-res PDF of the map. Units in the statistics table are same as map units. Z_min and Z_max refer to the minima and maxima with their respective geographic locations.

↑ back to the top
Laske sediment thickness
There is no grid with 2m resolution for this region available

Comments

For explanation to the data source or computation of this grid please follow this link. Clicking the image will open a high-res PDF of the map. Units in the statistics table are same as map units. Z_min and Z_max refer to the minima and maxima with their respective geographic locations.

↑ back to the top
Total crustal thickness
There is no grid with 2m resolution for this region available

Comments

For explanation to the data source or computation of this grid please follow this link. Clicking the image will open a high-res PDF of the map. Units in the statistics table are same as map units. Z_min and Z_max refer to the minima and maxima with their respective geographic locations.

↑ back to the top
Base hard sediments
There is no grid with 2m resolution for this region available

Comments

For explanation to the data source or computation of this grid please follow this link. Clicking the image will open a high-res PDF of the map. Units in the statistics table are same as map units. Z_min and Z_max refer to the minima and maxima with their respective geographic locations.

↑ back to the top
Base upper crust
There is no grid with 2m resolution for this region available

Comments

For explanation to the data source or computation of this grid please follow this link. Clicking the image will open a high-res PDF of the map. Units in the statistics table are same as map units. Z_min and Z_max refer to the minima and maxima with their respective geographic locations.

↑ back to the top
Base middle crust
There is no grid with 2m resolution for this region available

Comments

For explanation to the data source or computation of this grid please follow this link. Clicking the image will open a high-res PDF of the map. Units in the statistics table are same as map units. Z_min and Z_max refer to the minima and maxima with their respective geographic locations.

↑ back to the top
Base lower crust
There is no grid with 2m resolution for this region available

Comments

For explanation to the data source or computation of this grid please follow this link. Clicking the image will open a high-res PDF of the map. Units in the statistics table are same as map units. Z_min and Z_max refer to the minima and maxima with their respective geographic locations.

↑ back to the top
Plain crustal thickness
There is no grid with 2m resolution for this region available

Comments

For explanation to the data source or computation of this grid please follow this link. Clicking the image will open a high-res PDF of the map. Units in the statistics table are same as map units. Z_min and Z_max refer to the minima and maxima with their respective geographic locations.

↑ back to the top
OzSEEBASE sediment thickness
There is no grid with 2m resolution for this region available

Comments

For explanation to the data source or computation of this grid please follow this link. Clicking the image will open a high-res PDF of the map. Units in the statistics table are same as map units. Z_min and Z_max refer to the minima and maxima with their respective geographic locations.

↑ back to the top
OzSEEBASE depth2basement
There is no grid with 2m resolution for this region available

Comments

For explanation to the data source or computation of this grid please follow this link. Clicking the image will open a high-res PDF of the map. Units in the statistics table are same as map units. Z_min and Z_max refer to the minima and maxima with their respective geographic locations.

↑ back to the top
OzSEEBASE crustal thickness
There is no grid with 2m resolution for this region available

Comments

For explanation to the data source or computation of this grid please follow this link. Clicking the image will open a high-res PDF of the map. Units in the statistics table are same as map units. Z_min and Z_max refer to the minima and maxima with their respective geographic locations.

↑ back to the top
Mantle Lid thickness
There is no grid with 2m resolution for this region available

Comments

For explanation to the data source or computation of this grid please follow this link. Clicking the image will open a high-res PDF of the map. Units in the statistics table are same as map units. Z_min and Z_max refer to the minima and maxima with their respective geographic locations.

↑ back to the top

Analysis

Isostatic correction
There is no grid with 2m resolution for this region available

Comments

For explanation to the data source or computation of this grid please follow this link. Clicking the image will open a high-res PDF of the map. Units in the statistics table are same as map units. Z_min and Z_max refer to the minima and maxima with their respective geographic locations.

↑ back to the top
TTS (sediment)
There is no grid with 2m resolution for this region available

Comments

For explanation to the data source or computation of this grid please follow this link. Clicking the image will open a high-res PDF of the map. Units in the statistics table are same as map units. Z_min and Z_max refer to the minima and maxima with their respective geographic locations.

↑ back to the top
Beta (Sediment)
There is no grid with 2m resolution for this region available

Comments

For explanation to the data source or computation of this grid please follow this link. Clicking the image will open a high-res PDF of the map. Units in the statistics table are same as map units. Z_min and Z_max refer to the minima and maxima with their respective geographic locations.

↑ back to the top
Crustal vs lithosph. extn.
There is no grid with 2m resolution for this region available

Comments

For explanation to the data source or computation of this grid please follow this link. Clicking the image will open a high-res PDF of the map. Units in the statistics table are same as map units. Z_min and Z_max refer to the minima and maxima with their respective geographic locations.

↑ back to the top
Anomalous TTS
There is no grid with 2m resolution for this region available

Comments

For explanation to the data source or computation of this grid please follow this link. Clicking the image will open a high-res PDF of the map. Units in the statistics table are same as map units. Z_min and Z_max refer to the minima and maxima with their respective geographic locations.

↑ back to the top
Predicted elevation
There is no grid with 2m resolution for this region available

Comments

For explanation to the data source or computation of this grid please follow this link. Clicking the image will open a high-res PDF of the map. Units in the statistics table are same as map units. Z_min and Z_max refer to the minima and maxima with their respective geographic locations.

↑ back to the top
Beta (Crust)
There is no grid with 2m resolution for this region available

Comments

For explanation to the data source or computation of this grid please follow this link. Clicking the image will open a high-res PDF of the map. Units in the statistics table are same as map units. Z_min and Z_max refer to the minima and maxima with their respective geographic locations.

↑ back to the top
TTS (crust)
There is no grid with 2m resolution for this region available

Comments

For explanation to the data source or computation of this grid please follow this link. Clicking the image will open a high-res PDF of the map. Units in the statistics table are same as map units. Z_min and Z_max refer to the minima and maxima with their respective geographic locations.

↑ back to the top
Differential Beta
There is no grid with 2m resolution for this region available

Comments

For explanation to the data source or computation of this grid please follow this link. Clicking the image will open a high-res PDF of the map. Units in the statistics table are same as map units. Z_min and Z_max refer to the minima and maxima with their respective geographic locations.

↑ back to the top

This basin data sheet is based on interpolated and upsampled global grids.


Page created 2008-08-03 02:36:37 CEST | © 2005-2008 Christian Heine, School of Geosciences, Sydney University, Australia