 A team led by the University of Sydney School of Geosciences has created the first digital globe of seafloor sediments.
Ocean sediments cover 70% of our planet’s surface, forming the substrate for the largest ecosystem on Earth and its largest carbon reservoir – but the most recent map of seafloor geology was drawn by hand over 40 years ago, at the dawn of modern ocean exploration.
That’s about to change. In a gargantuan effort Adriana Dutkiewicz and her colleagues carefully analysed and categorised 15,000 seafloor sediment samples to reveal the nature of sedimentary blankets over ocean ridges, seamounts and the vast abyssal plains. She teamed up with big data experts to find the best way to use modern computer algorithms to turn the vast sea of point observations into a continuous digital map.
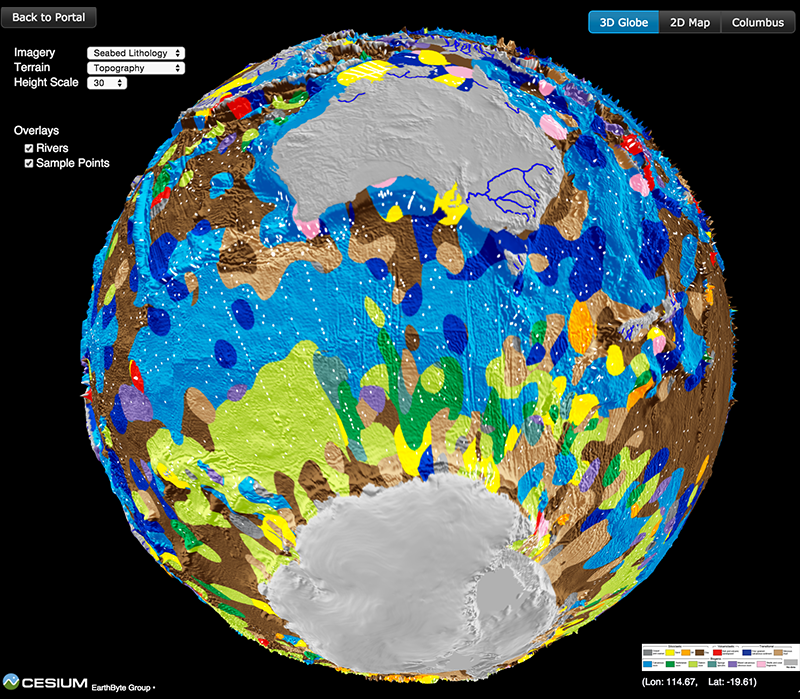
The first “census of seafloor sediments” reported in the journal Geology is rendered as a spectacular, interactive spinning virtual globe that allows anyone to fly through the colourful patchwork of seafloor geology draped over a terrain map.
Dr. Dutkiewicz says: “The new map completely changes our understanding of what’s down there. We find a complex patchwork where in the 70s large continuous belts of seafloor sediments were mapped.”
Why is this important? The deep ocean floor is a graveyard with much of it made up of microscopic sea creatures called phytoplankton, whose dead remains rain down through the water column like “marine snow”. The composition of their shells is used to decipher how our oceans have responded to past climate change.
Tiny organisms called diatoms, thriving in sunlit surface waters, produce about a quarter of the oxygen we breathe, and they make a bigger contribution to fighting global warming than most plants on land.
Their dead remains sink to the bottom of the ocean, locking away their carbon.
Co-author Prof. Dietmar Müller explains: Satellites map chlorophyll concentrations in the surface ocean, but so far we haven’t had any reliable maps of where diatoms accumulate on the seafloor – we understand the carbon source, but not the sink.”
Surprisingly, the new seafloor geology map demonstrates that diatom accumulations on the seafloor are nearly entirely decoupled from diatom productivity maxima in surface waters in the Southern Ocean. Independently, a similar decoupling was recently reported for the Northeast Pacific, supporting these results.
Dr. Dutkiewicz notes: “That means oceanographers and marine geologists have some work to do. Now that Australia has a brand-new marine research vessel, the Investigator, our research opens the door to future voyages aimed at better understanding the workings and history of the marine carbon cycle.”
Müller adds: “Big Data technologies, paired with old and new data, now allow us to better predict the impact changing climate and ecosystems may have on the life cycle of diatoms, by jointly analysing a multitude of sea surface and seafloor observations.”
Co-author Dr. O’Callaghan from NICTA concludes: “The recent images of Pluto’s icy plains are spectacular, but the process of unveiling the hidden geological secrets of the abyssal plains of our own planet was equally full of surprises!”
Open-access paper ‘Census of seafloor sediments in the world’s ocean’
Interactive seafloor globe that can be viewed on any browser on smartphones, tablets or computers
![]()
