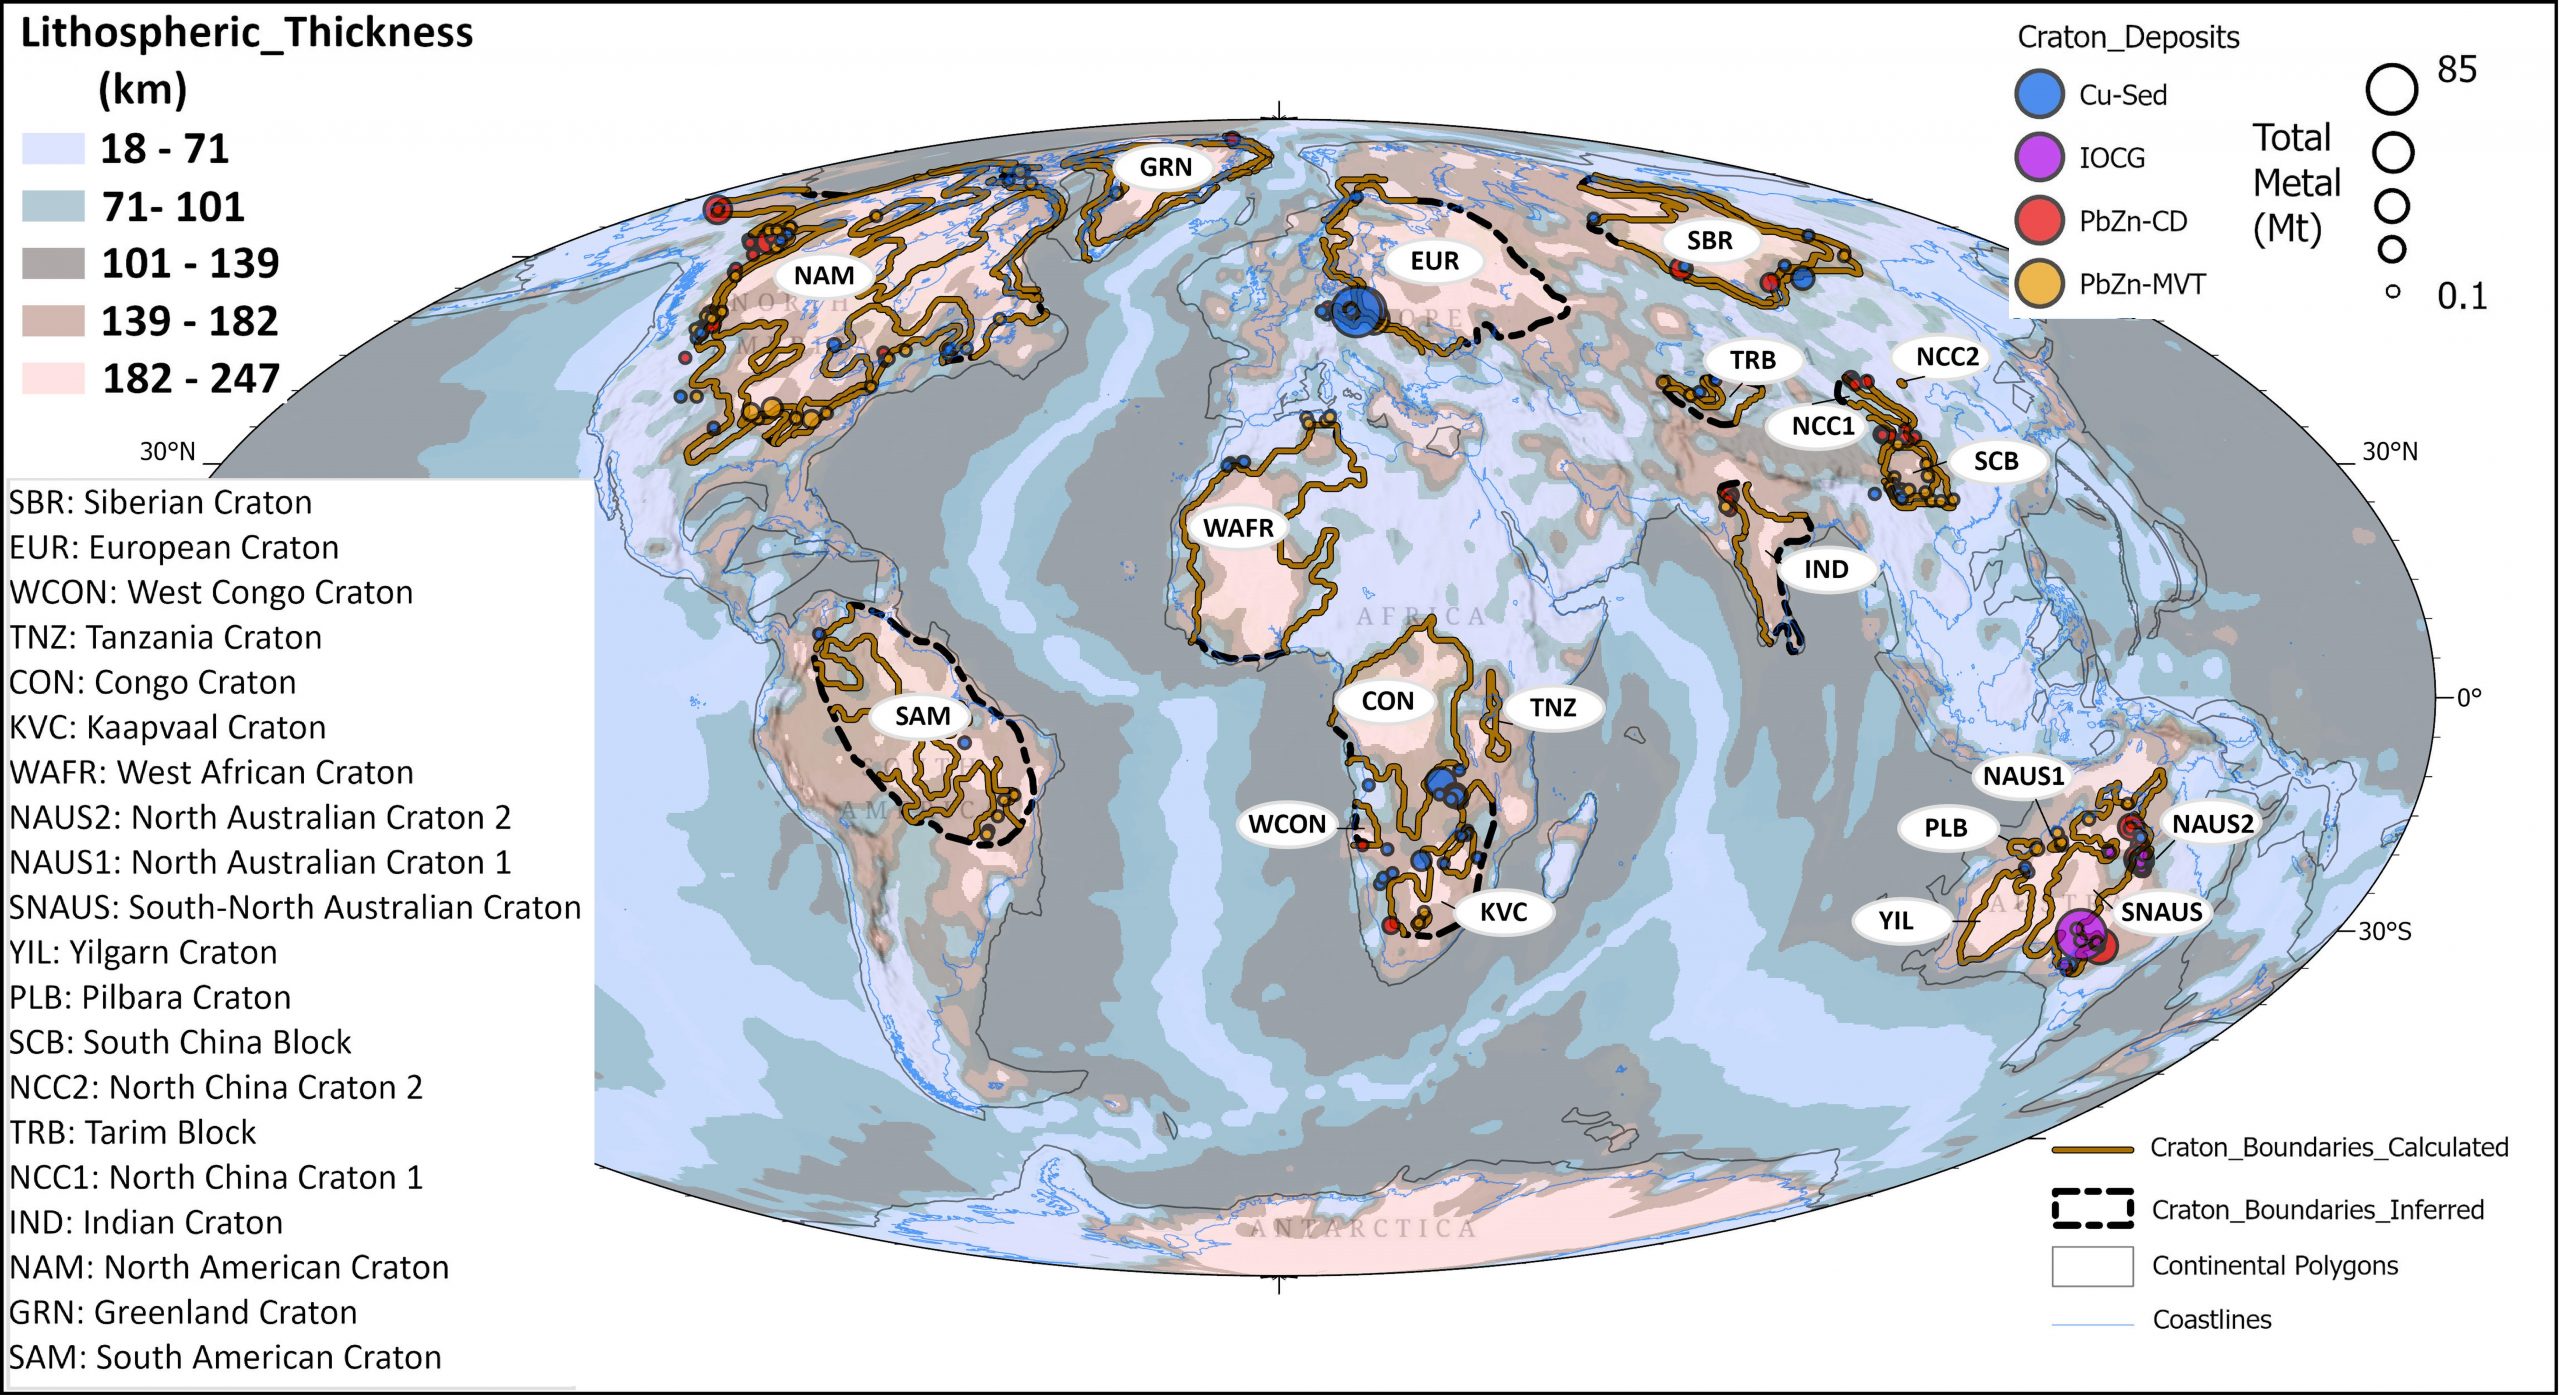
Craton margins play a crucial role in mineral exploration as they host faults, fractures, and shear zones that facilitate hydrothermal fluid movement, transporting and depositing dissolved metals into valuable mineral deposits. We use the high-resolution full-waveform seismic inversion model REVEAL to extract horizontal shear wave velocity (VSH), vertical shear wave velocity (VSV), and isotropic P-wave velocity (VP) across depth slices from 150 to 200 km, a range that captures most cratonic lithosphere based on tectonic age and lithospheric thickness analyses. Machine learning, applied through clustered maps, demonstrates that VSH effectively delineates craton boundaries, aligning with target mineral deposits, including iron oxide copper–gold (IOCG) and sediment-hosted lead, zinc, and copper deposits. These boundaries are characterized by high horizontal shear velocities (4.58–4.68 km/s), and trace the edges of cratons, accreted passive margins, orogens, and thick volcanic arcs. Using published thermal and lithospheric thickness models, we distinguish cratons from other thick lithospheric features and identify their edges and associated deposits. Our results show that ∼85 % of the total metal content (Cu + Pb + Zn) in target deposits lies within ∼120 km of high-velocity cluster boundaries identified as craton edges. Near-craton deposits reveal ∼80 % of the total metal content within ∼90 km of craton boundaries. The weighted cumulative distribution function shows a steeper gradient in metal content closer to craton boundaries, indicating higher concentrations near these tectonic features. Focusing on just 16 % of Earth’s continental areas can reveal over 80 % of known target deposits, highlighting the significance of craton boundaries quantitatively mapped in this study.
Curious about Australian cratons? Read the full story in Precompetitive Review. A summary is provided below.
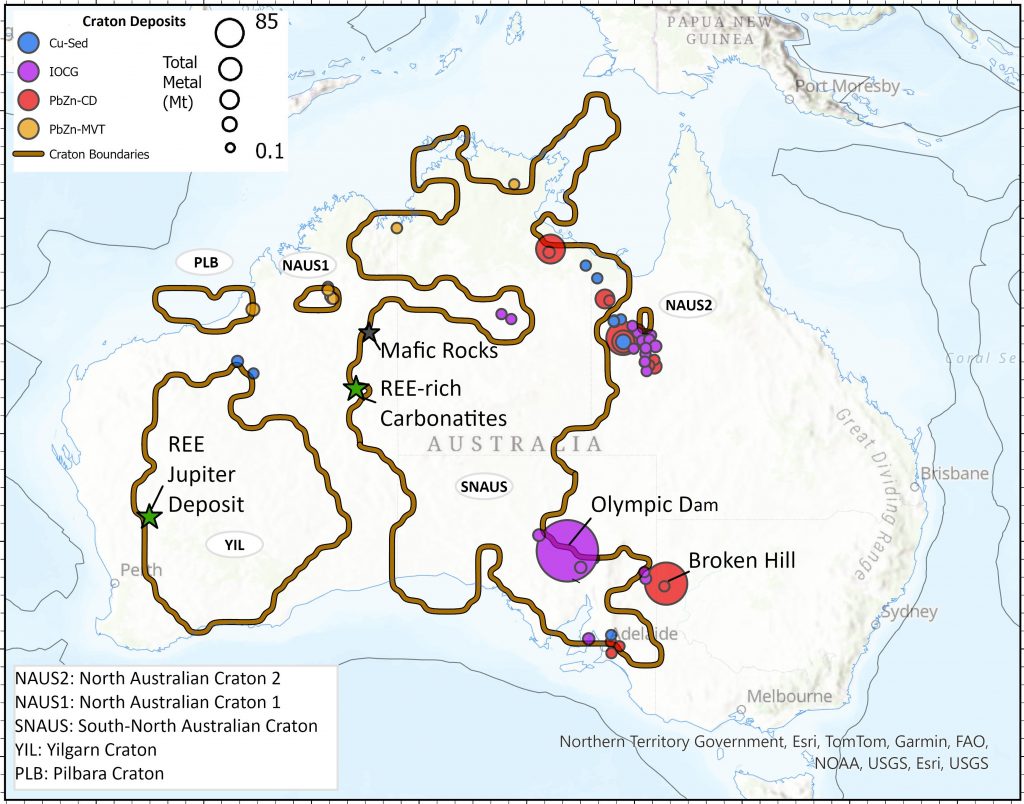
- The search space for sediment-hosted and IOCG deposits has been drastically reduced by remarkable new mapping of craton boundaries by a University of Sydney PhD candidate. Exciting work led by Hojat Shirmardgouravan has newly mapped the world’s craton boundaries with a novel combination of global seismic tomography, machine learning and other techniques. The new paper then takes a further step by showing 80% of the total metal content of the world’sPb-Zn-Cu sediment-hosted deposits lies within a 90-km wide corridor, and about 90% within 110 km. For instance, a new study by the Geological Survey of South Australia of the under-explored Nuyts Domain of the Gawler Craton has provided constraints on a complex package of sediments and intrusives and raised the prospectivity for Ni-Cu.
- Officer Basin, WA: The refined map reveals craton edges on either side of the Officer Basin, closely aligning with recent Geological Survey of WA interpretations. This significantly enhances the copper prospectivity of the Officer and underlying Salvation basins. Notably, industry is already moving into the area, with Encounter Resources, Teck Resources, and Rio Tinto acquiring ground in the region’s southwest.
- Northern Australia Craton (NAC): There is a striking “re-entrant” feature extending from the East Kimberley through the southern Birrindudu Basin and Tanami region, curving west of Tennant Creek. This structure almost bisects the NAC and supports the interpretation of the NAC as comprising two distinct lithospheric blocks. This existence of this feature is backed up by a revised thermomechanical model of the Australian plate by Mark Hoggard, released by Geoscience Australia (https://ecat.ga.gov.au/geonetwork/srv/eng/catalog.search#/metadata/149411) at last year’s final EFTF Showcase.
- Gawler Craton, SA: The study suggests a major re-evaluation of craton boundaries in South Australia. The western boundary lies much farther west than previously mapped, coinciding with the Mundrabilla Shear Zone in WA. The eastern boundary is strikingly different, running east-west from the Curnamona Province and Broken Hill through the Flinders Ranges—directly beneath Olympic Dam—before swinging north toward Coober Pedy. In the southeast, the boundary lies further east than traditional interpretations, aligning with a 2022 Geoscience Australia seismic line. Intriguingly, the map also shows the Gawler Craton joined with the NAC, challenging existing tectonic models of central Australia.
![]()
