Seafloor roughness varies considerably across the world’s ocean basins and is fundamental to controlling the circulation and mixing of heat in the ocean and dissipating eddy kinetic energy. Models derived from analyses of active mid-ocean ridges suggest that ocean floor roughness depends on seafloor spreading rates, with rougher basement forming below a half-spreading rate threshold of 30-35 mm/yr, as well as on the local interaction of mid-ocean ridges with mantle plumes or cold-spots.
Here we present a global analysis of marine gravity-derived roughness, sediment thickness, seafloor isochrons and palaeospreading rates of Cretaceous to Cenozoic ridge flanks. Our analysis reveals that, after eliminating effects related to spreading rate and sediment thickness, residual roughness anomalies of 5-20 mGal remain over large swaths of ocean floor. We found that the roughness as a function of palaeospreading directions and isochron orientations indicates that most of the observed excess roughness is not related to spreading obliquity, as this effect is restricted to relatively rare occurrences of very high obliquity angles (> 45 degrees). Cretaceous Atlantic ocean floor, formed over mantle previously overlain by the Pangaea supercontinent, displays anomalously low roughness away from mantle plumes and independent of spreading rates. We attribute this observation to a sub-Pangaean supercontinental mantle temperature anomaly leading to slightly thicker than normal Late Jurassic and Cretaceous Atlantic crust, reduced brittle fracturing and smoother basement relief. In contrast, ocean crust formed above Pacific superswells, probably reflecting metasomatized lithosphere underlain by mantle at only slightly elevated temperatures, is not associated with basement roughness anomalies. These results highlight a fundamental difference in the nature of large-scale mantle upwellings below supercontinents and superoceans, and their impact on oceanic crustal accretion.
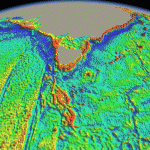
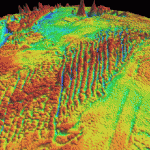
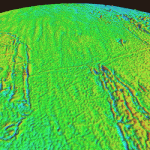
Figure caption: (left) The seafloor of the Tasman Sea and SE Australia. Large fracture zones are visible south of Australia as well as the relatively smooth Tasman Sea ocean floor with its extinct spreading ridge to the east. (centre) The rough seafloor of the Indian Ocean – looking north towards Madagascar we see the extremely rough ocean floor, dissected by giant fracture zones across the Southwest Indian Ridge. (right) The smooth seafloor of the Pacific Ocean – looking westward across the Pacific from Ecuador. In the foreground the Cocos-Nazca mid-ocean ridge intersects with the Pacific mid-ocean ridge and in the background the smooth Pacific Plate stretches out to the horizon.
Documents
Nature Paper
Download Grids
Downward Continued Gravity
Roughness 100 km
Roughness 160 km
Residual Roughness
Predicted Roughness
Grids in Different Formats
Download Images
Images from Paper
Images from Website
Related Datasets
2008 Agegrid
NGDC Sediment Thickness
Publicity
USyd Press Release
Krimi am Meeresgrund
Cyberpresse
License
![]() This work is licensed under a Creative Commons Attribution 3.0 Unported License.
This work is licensed under a Creative Commons Attribution 3.0 Unported License.
![]()


