Author List: Dietmar Müller, Rakib Hassan, Michael Garnis, Nicolas Flament, Simon Williams.
Citation: Müller, Dietmar & Hassan, Rakib & Gurnis, M & Flament, Nicolas & Williams, Simon. (2018). Dynamic topography of passive continental margins and their hinterlands since the Cretaceous. Gondwana Research. . 10.1016/j.gr.2017.04.028.
Abstract:
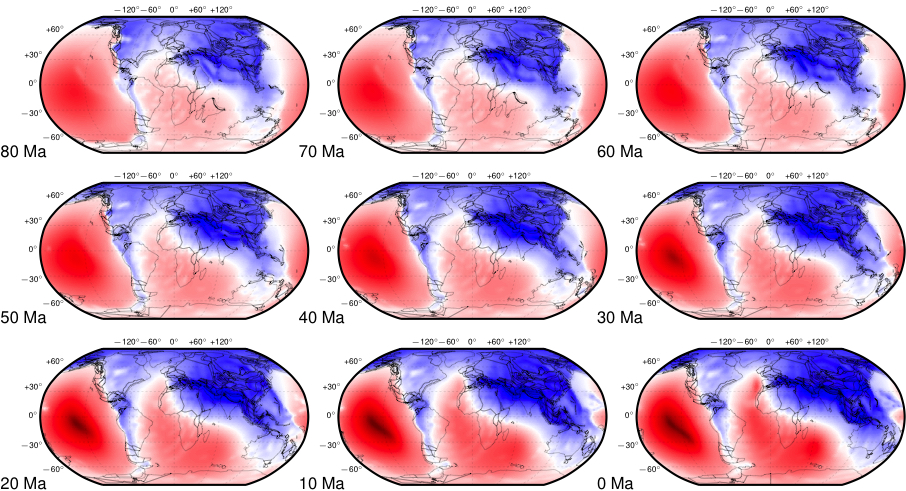
Even though it is well accepted that the Earth’s surface topography has been affected by mantle-convection induced dynamic topography, its magnitude and time-dependence remain controversial. The dynamic influence to topographic change along continental margins is particularly difficult to unravel, because their stratigraphic record is dominated by tectonic subsidence caused by rifting. We follow a three-fold approach to estimate dynamic topographic change along passive margins based on a set of seven global mantle convection models. We first demonstrate that a geodynamic forward model that includes adiabatic and viscous heating in addition to internal heating from radiogenic sources, and a mantle viscosity profile with a gradual increase in viscosity below the mantle transition zone, provides a greatly improved match to the spectral range of residual topography end-members as compared with previous models at very long wavelengths (spherical degrees 2-3). We then combine global sea level estimates with predicted surface dynamic topography to evaluate the match between predicted continental flooding patterns and published paleo-coastlines by comparing predicted versus geologically reconstructed land fractions and spatial overlaps of flooded regions for individual continents since 140 Ma. Modelled versus geologically reconstructed land fractions match within 10% for most models, and the spatial overlaps of inundated regions are mostly between 85% and 100% for the Cenozoic, dropping to about 75-100% in the Cretaceous. Regions that have been strongly affected by mantle plumes are generally not captured well in our models, as plumes are suppressed in most of them, and our models with dynamically evolving plumes do not replicate the location and timing of observed plume products. We categorise the evolution of modelled dynamic topography in both continental interiors and along passive margins using cluster analysis to investigate how clusters of similar dynamic topography time series are distributed spatially. A subdivision of four clusters is found to best reveal end-members of dynamic topography evolution along passive margins and their hinterlands, differentiating topographic stability, long-term pronounced subsidence, initial stability over a dynamic high followed by moderate subsidence and regions that are relatively proximal to subduction zones with varied dynamic topography histories. Along passive continental margins the most commonly observed process is a gradual motion from dynamic highs towards lows during the fragmentation of Pangea, reflecting the location of many passive margins now over slabs sinking in the lower mantle. Our best-fit model results in up to 500 (±150) m of total dynamic subsidence of continental interiors while along passive margins the maximum predicted dynamic topographic change over 140 million years is about 350 (±150) m of subsidence. Models with plumes exhibit clusters of transient passive margin uplift of about 200 ±200m, but are mainly characterised by long-term subsidence of up to 400 m. The good overall match between predicted dynamic topography to geologically mapped paleo-coastlines makes a convincing case that mantle-driven topographic change is a critical component of relative sea level change, and indeed the main driving force for generating the observed geometries and timings of large-scale continental inundation through time.
Link to dynamic topography grids in mantle and plate reference frame, as well as digital sea level curves used in this paper:
https://www.earthbyte.org/webdav/ftp/Data_Collections/Muller_etal_2018_GR/
and the dynamic topography grids are also available as virtual interactive globes here:
http://portal.gplates.org/portal/dt/
Download paper from ResearchGate
![]()
