
Using a similar method as our subduction zone analysis, we developed a workflow to sample oceanic crust composition along subduction zones. We wanted to observe the composition of the upper oceanic crust as it subducts. From our previous analysis we are able to resolve and extract subduction zone geometries from a plate kinematic model at a given time step using our python script ‘resolve_topolgies_v.2.py’. We employed the same method but this time using the Müller et al. (2016) plate model, for which the global palaeo-age grids for oceanic crust from 230 – 0 Ma are freely available online.
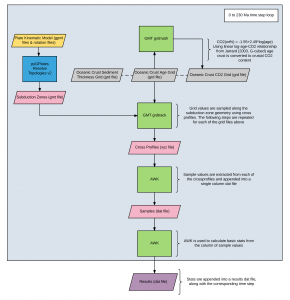
Employing our subduction zones and oceanic crust grid files, we sampled along the subduction zone geometries using the GMT tool grdtrack. At 10 km intervals along the subduction zone geometry, very short cross profiles are created ( ~2 km in length) where the profiles sample values from the intersecting node of the grid file. The cross profile outputs have 3 sampled values per profile. The three intervals are spaced 1km distances apart eg (1 km, 0 km and -1 km).
We created an awk script to obtain the middle value at 0 km of each cross profile and append this value to a dat file. This is because we are interested in observing the crust’s composition and sediment thickness as it removes carbon from the exogenic system through subduction.
The resultant dat file containing results is a compilation of grid values sampled along all subduction zones at 10 km intervals, as well as summary statistics such as the mean, median, standard deviation, maximum values, minimum values and sample count. These steps are repeated for each time step and for each of our grid types. Our grid types include crust age grid, seafloor sediment thickness grid and CO2 concentration in the upper crust.
Please note that our workflow is not restricted to the grid files that we used. There is potential to use this analysis with other grids, depicting alternative upper oceanic crust properties.
![]()
