During the Cretaceous to early Paleogene, atmospheric levels of carbon dioxide reached levels of 1 200 – 2 400 ppm. Concurrently, subduction zone lengths reached lengths of up to 52 000 km based on previous estimates, and were dominated by continental arcs. Continent-sourced carbonates too have a significant impact on CO2 flux from subduction volcanism. As continental arcs have a higher likelihood of interacting with crustal carbonate rocks, thus triggering decarbonation reactions, the heightened CO2 levels and dramatic increase in continental arc lengths may be causally related. We investigated this relationship in the project.
Comparing lengths of subduction zones that interact with carbonate platforms to atmospheric CO2 data
The results of the ‘active’ carbonate platform evolution model (Figure 1) and the carbonate platform accumulation model (Figure 2) and are presented here for comparison.
There is relatively little carbonate interaction with subduction volcanism in both models prior to ~ 240 Ma (Figure 1,2). From 240 Ma onward, both models indicate an increase in carbonate platform-volcanic arc interactions. In the active development model, intersections more than doubles at 100 Ma in comparison to ~260 Ma from 5 120 km to 14 7700 km (Figure 1) and this dramatic spike is not reflected in the accumulation model’s results (Figure 2). . Notably, this peak coincides with high atmospheric CO2 levels from the proxy record at 113 Ma (Figure 1, 4).
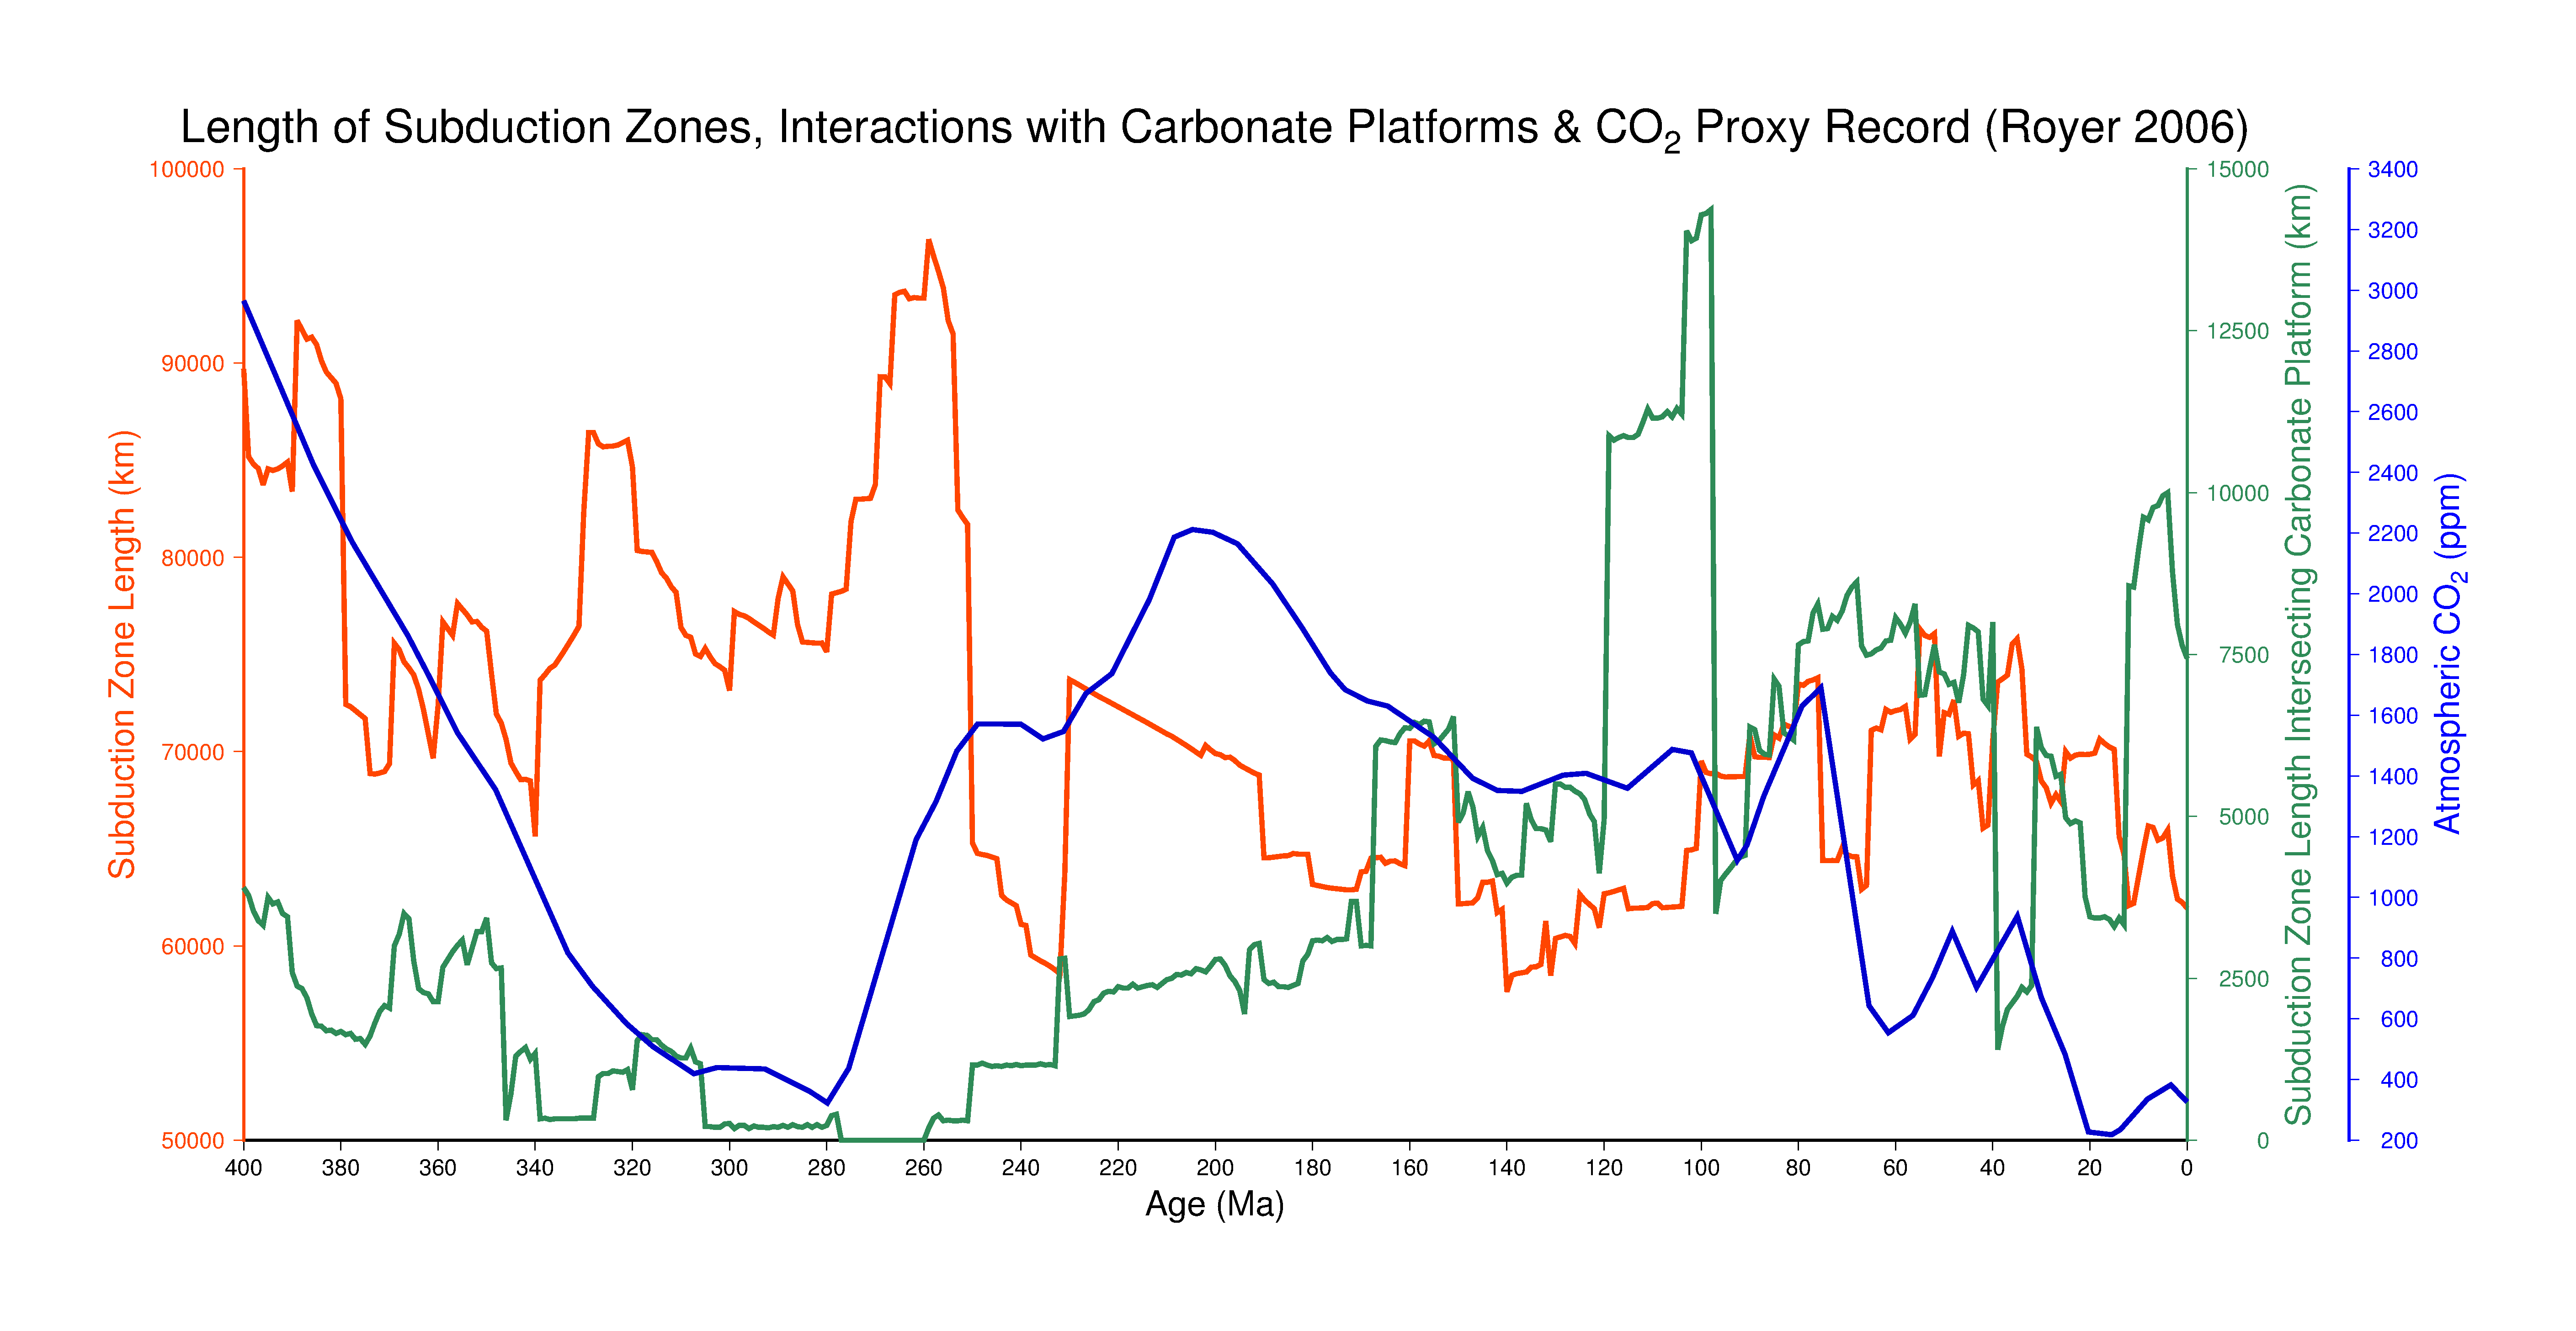
Figure 1. Total subduction zone lengths (red) and the interaction of subduction zone volcanism with ‘active’ carbonate platforms through time (green). The CO2 proxy record (blue) was obtained from Royer (2006).
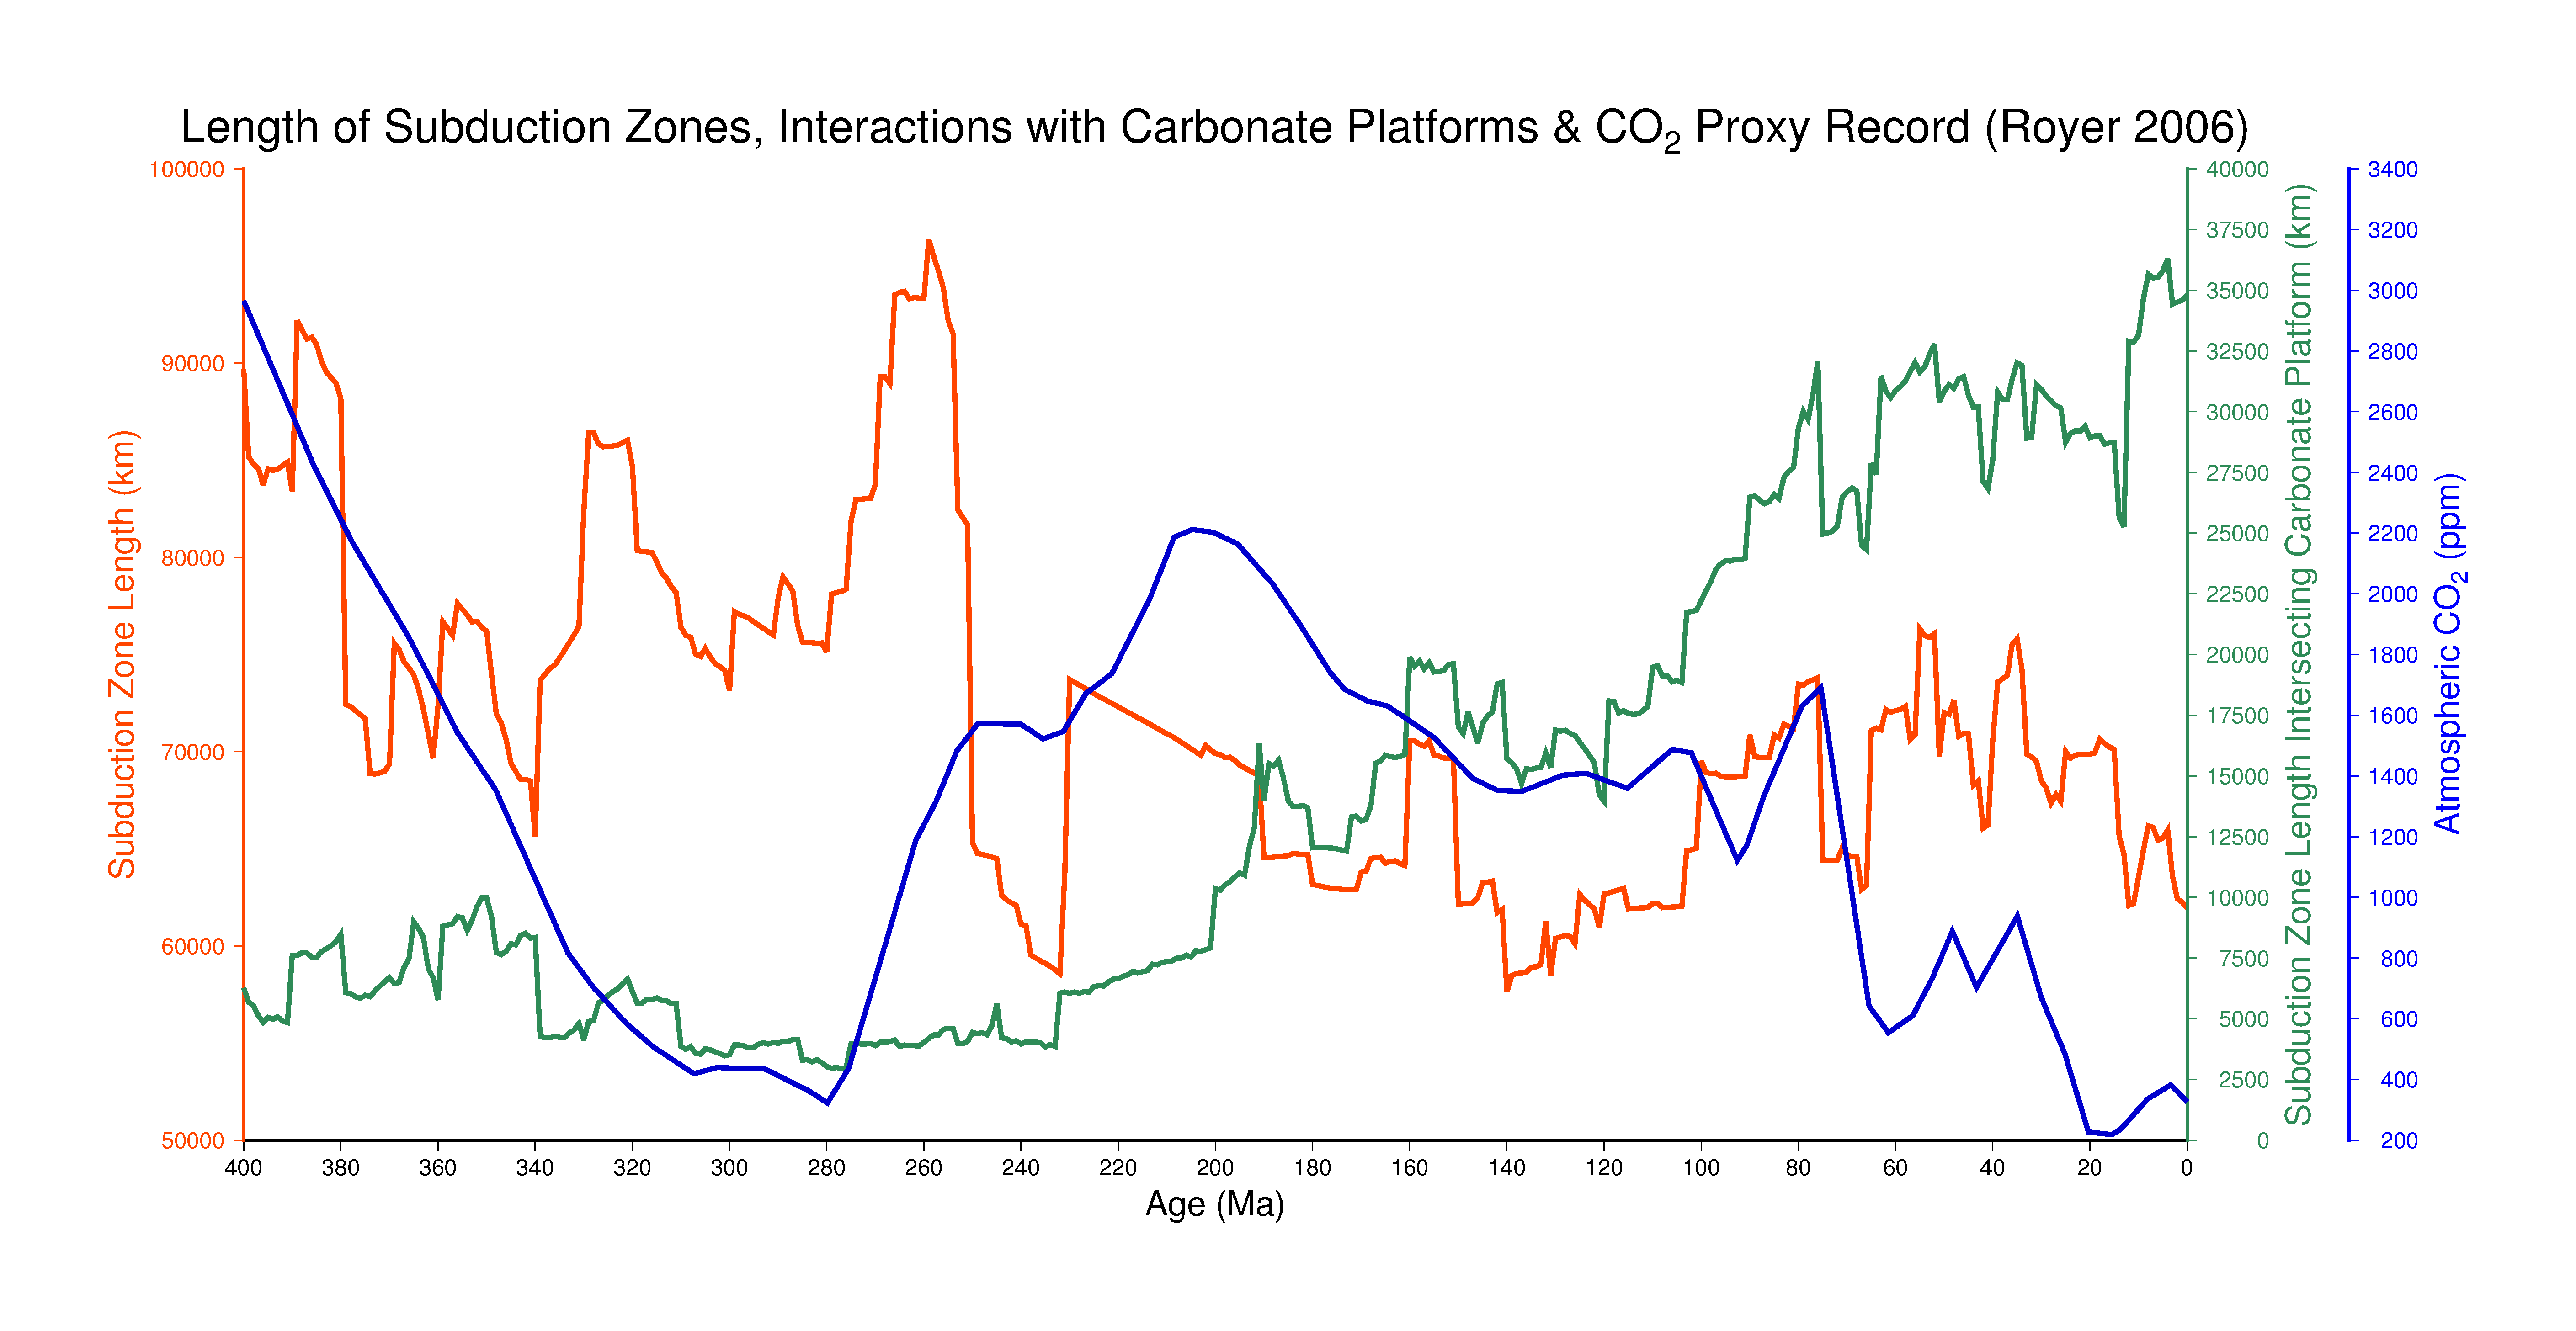
Figure 2. Total subduction zone lengths (red) and the interaction of subduction zone volcanism with accumulated carbonate platforms (green). The CO2 proxy record (blue) was obtained from Royer (2006).
Subduction zone classification and its influence on atmospheric CO2 flux
The proportion of subduction zone volcanism that can be classified as a continental arc dramatically increased around 250 Ma from an average of 55% of all subduction zones to 70-80% (Figure 3, 4). However, this is likely an artefact of the plate model’s construction in two parts which are stitched together at 250 Ma.
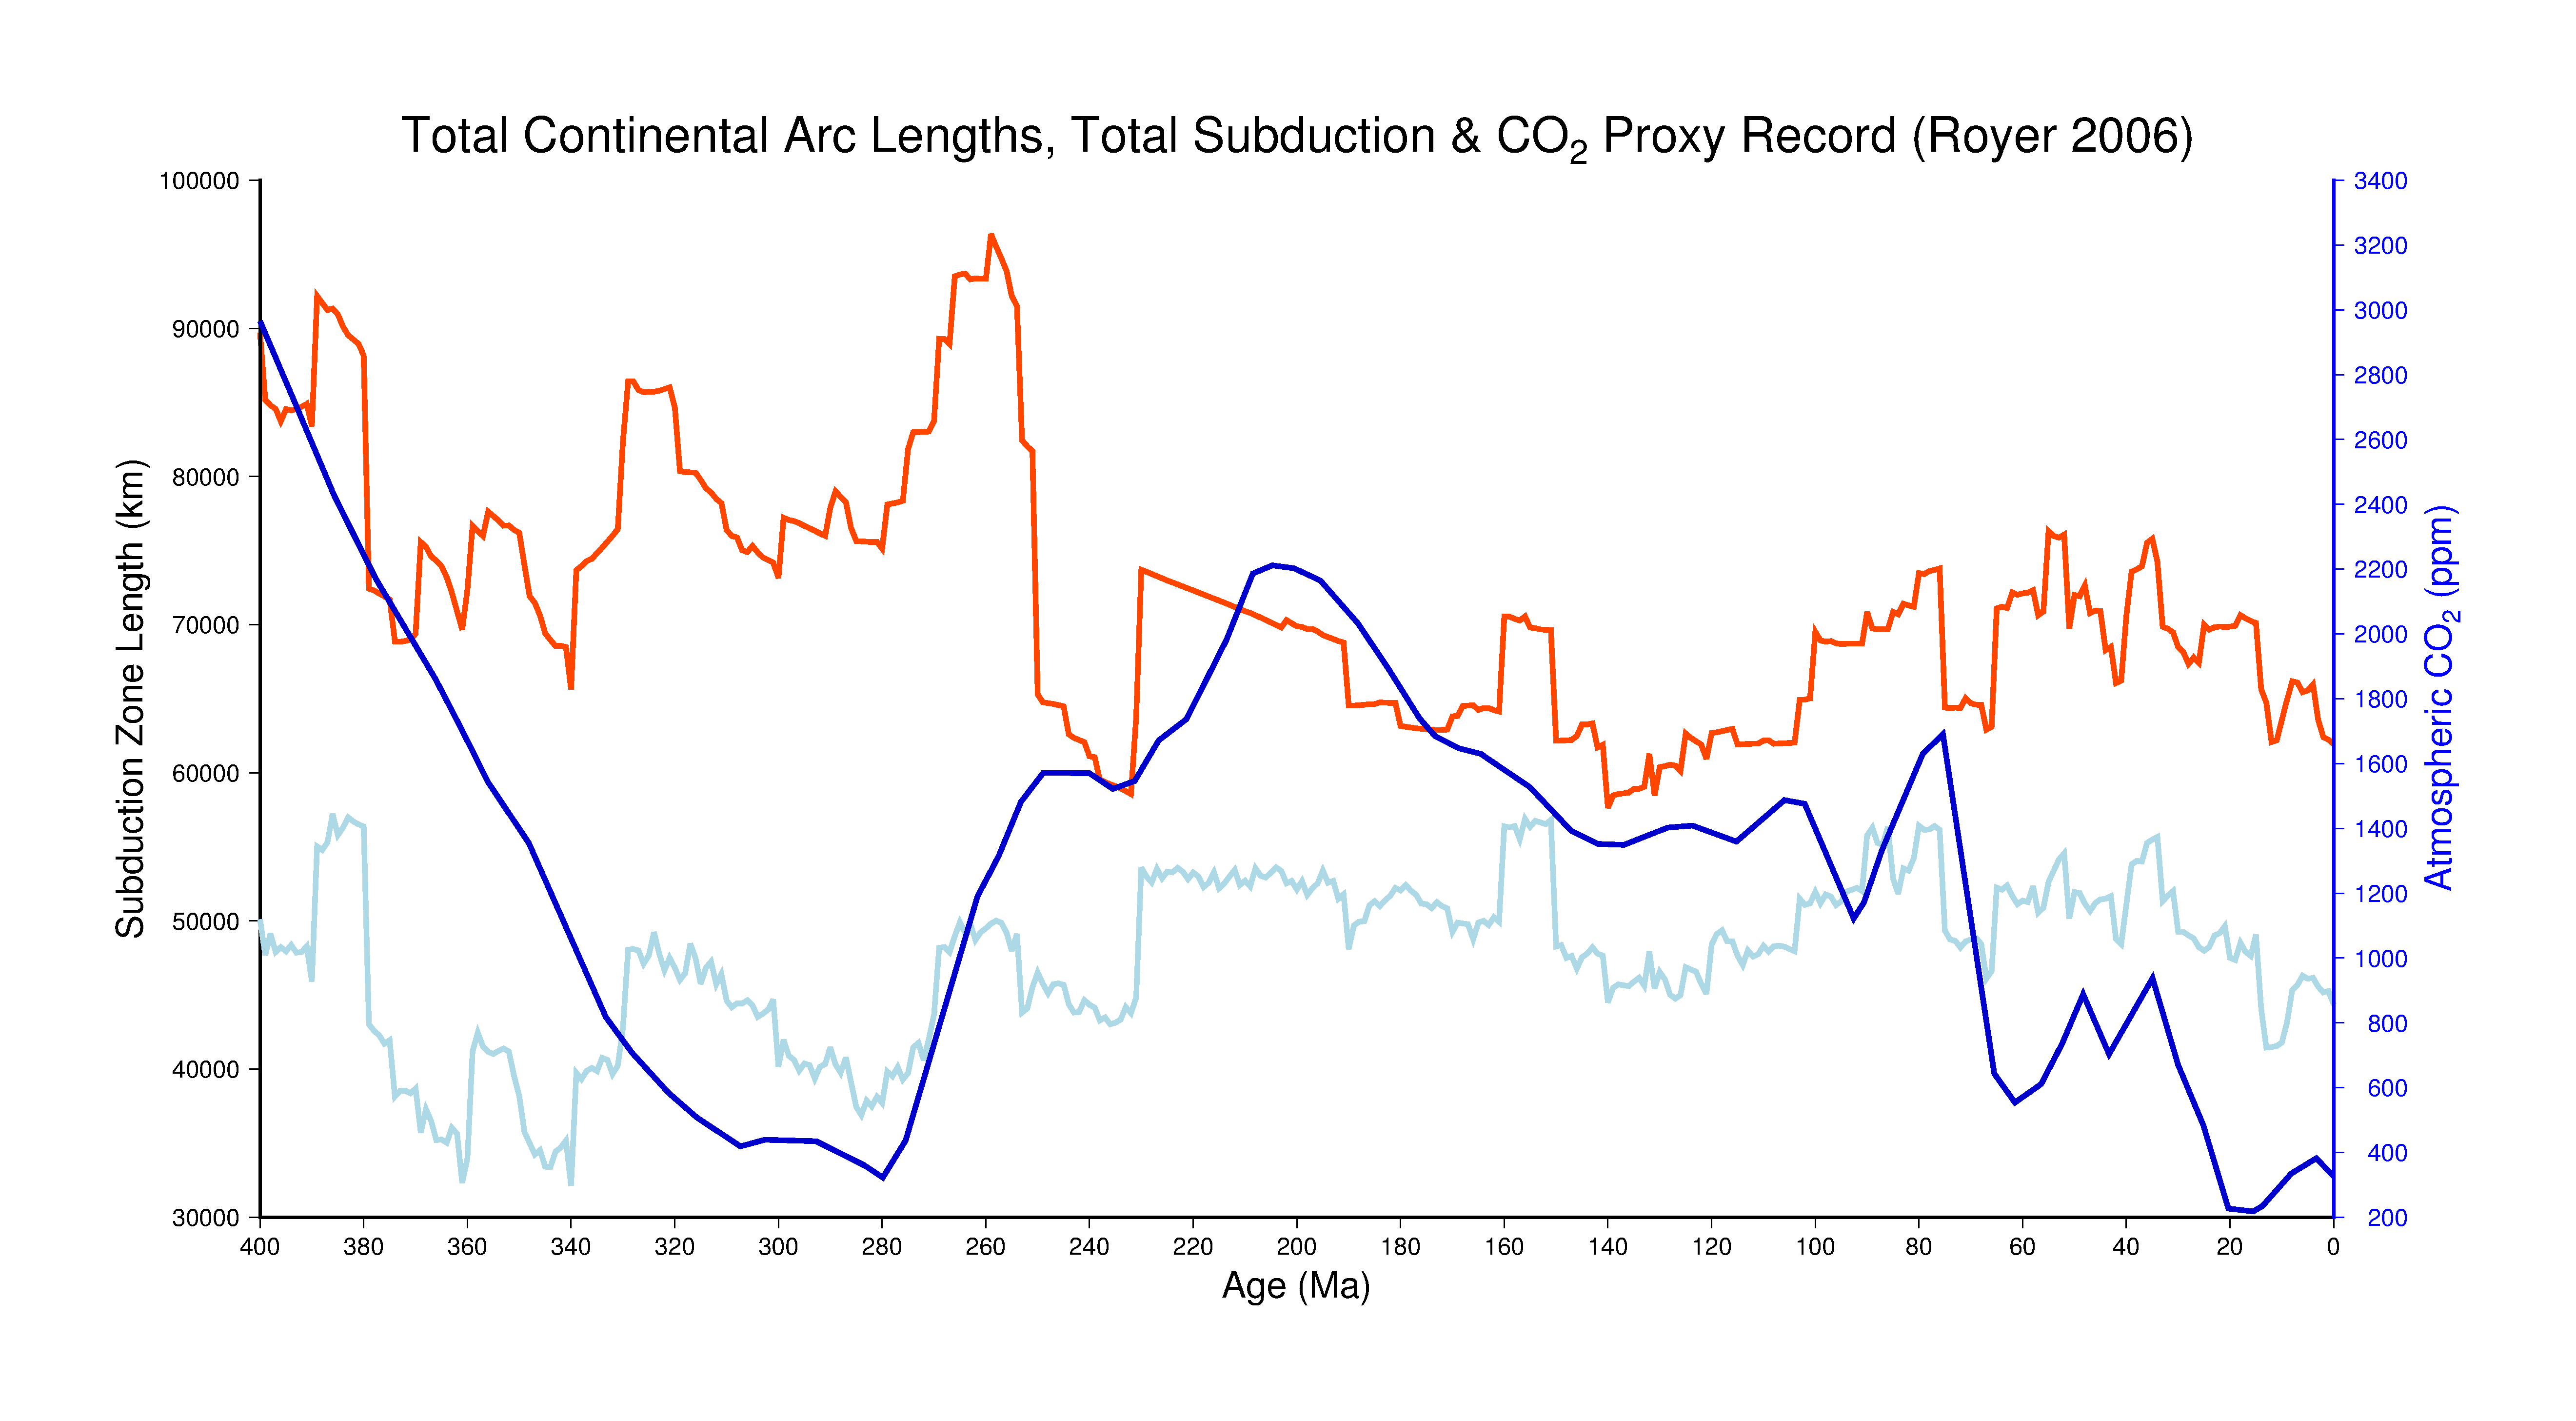
Figure 3. Percentage of Andean-style, continental arc subduction zones (light blue) as a proportion of global subduction zones (red) through time. The proxy record (blue) was obtained from Royer (2006).
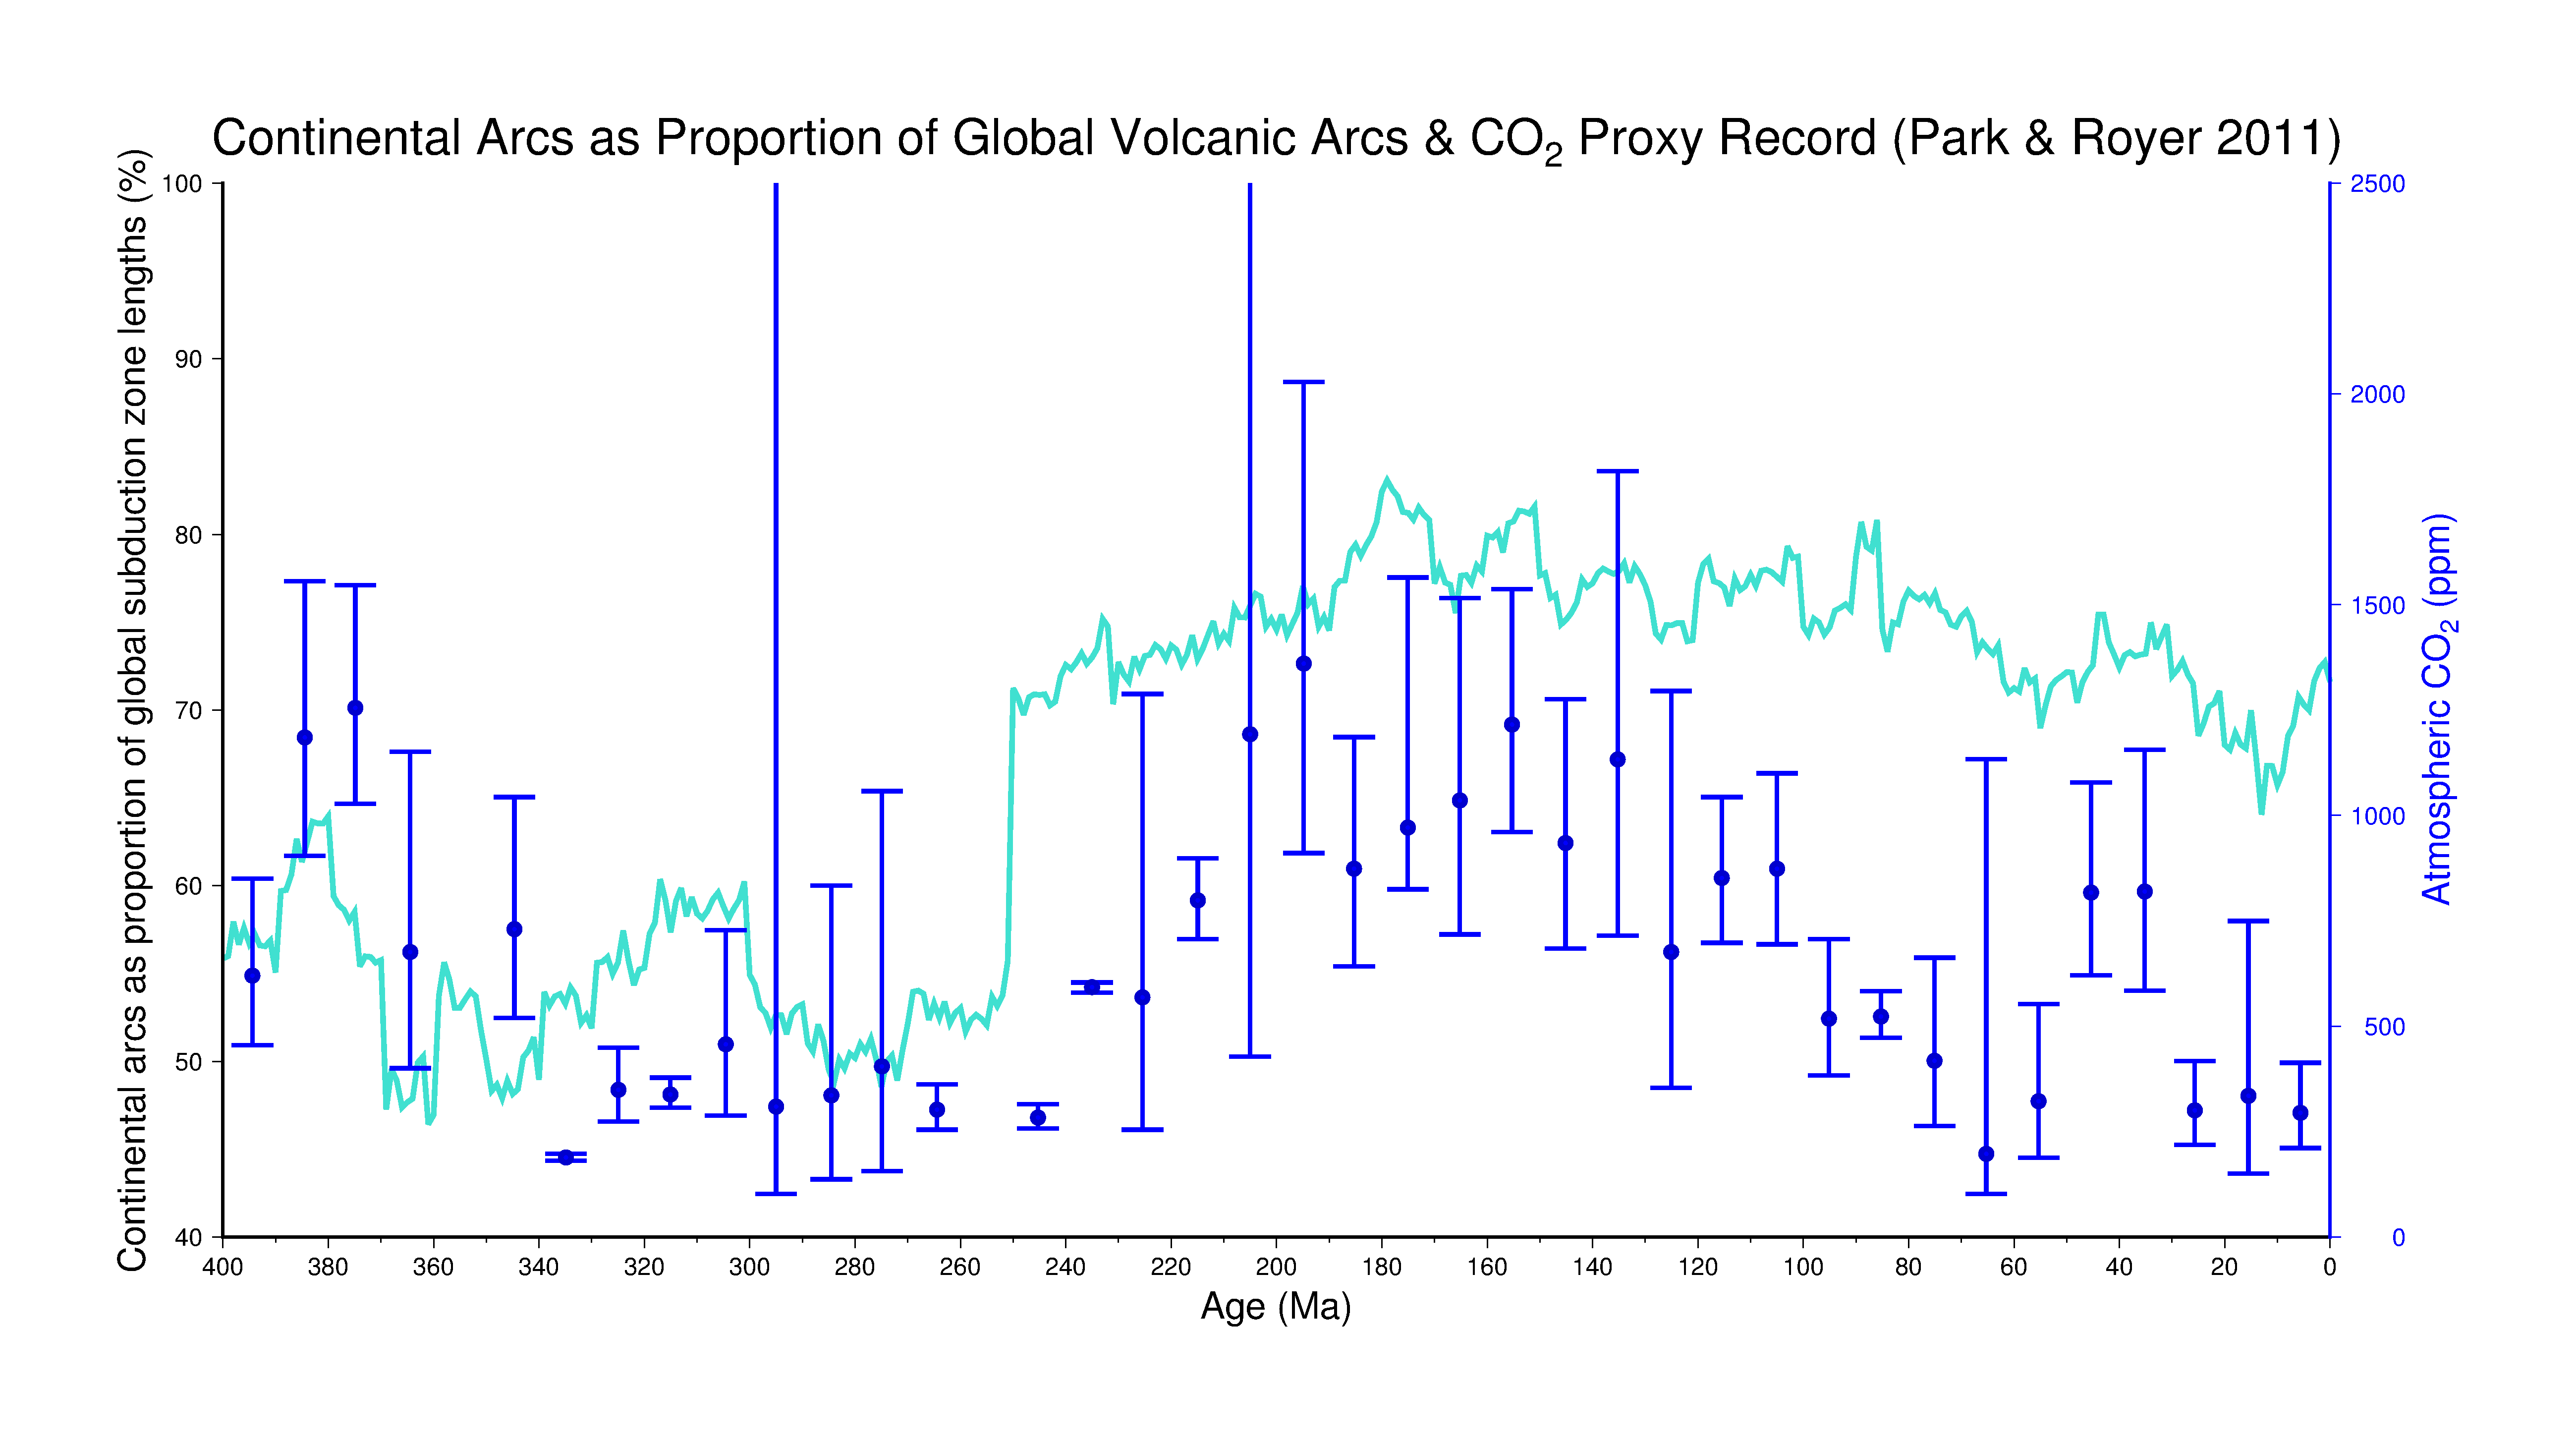
Figure 4. Proportion of global subduction zone lengths that are Andean-style continental arcs. The error bars of the CO2 proxy record (blue) was obtained from Park & Royer (2011).
![]()
