Extension velocities along Gondwana's Jurassic-Cenozoic rift systems. Each circle depicts the rift velocity of one passive margin point in terms of circle colour and size. Visit the interactive virtual rift globe here.
... Read more...
![]() EarthByte Multimedia is arranged into 3 categories, 'Plate Tectonics & Geodynamics', 'Basin Evolution & Surface Processes' and 'Presentations & More'. Click on the links below for a specific category, otherwise feel free to look through all the multimedia articles displayed on this page, or visit the EarthByte YouTube channel.
EarthByte Multimedia is arranged into 3 categories, 'Plate Tectonics & Geodynamics', 'Basin Evolution & Surface Processes' and 'Presentations & More'. Click on the links below for a specific category, otherwise feel free to look through all the multimedia articles displayed on this page, or visit the EarthByte YouTube channel.
EarthByter Andrew Merdith, Alan Collins from the Univ. of Adelaide and colleagues produced an animated plate tectonic map that changes the history of our planet as we know it. Of course it’s not just an animation, it’s an elaborate computer model that took years to be built, assimilating tons of geological and geophysical observations, in a … Read more…
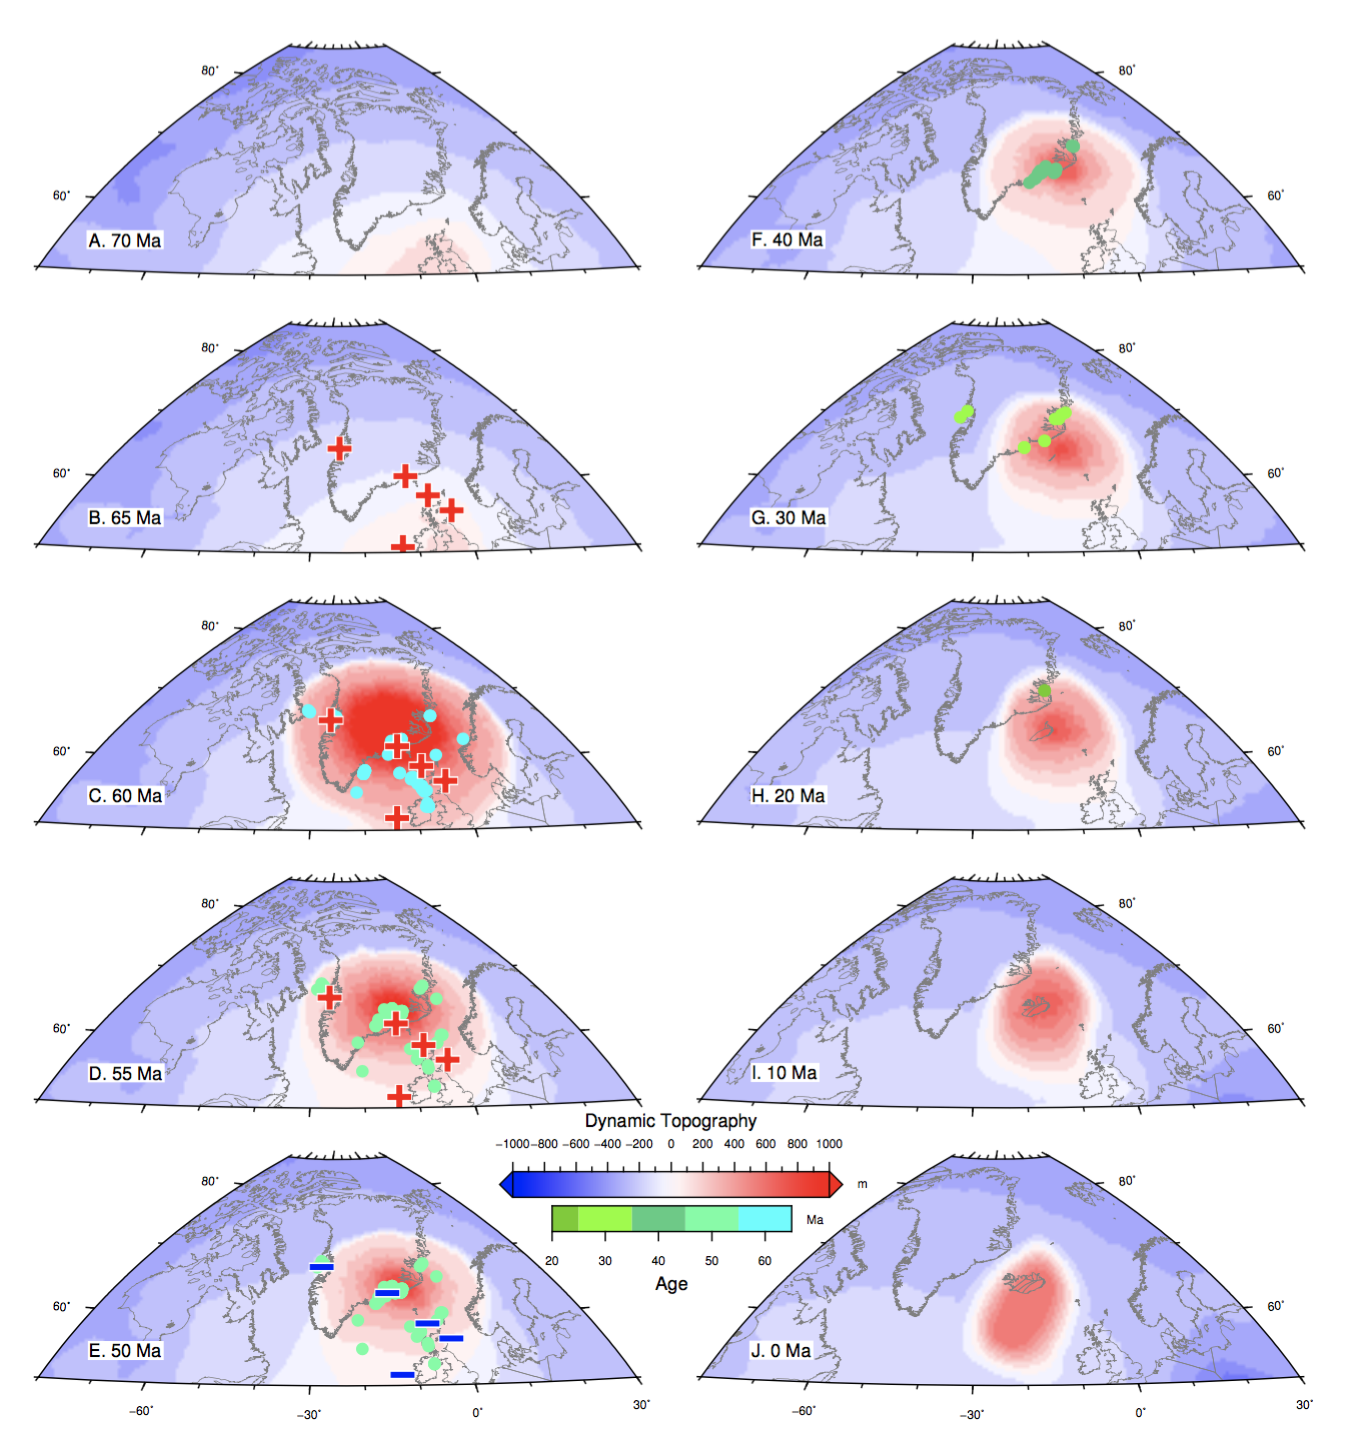
Abstract The present-day seismic structure of the mantle under the North Atlantic Ocean indicates that the Iceland hotspot represents the surface expression of a deep mantle plume, which is thought to have erupted in the North Atlantic domain during the Palaeocene. The spatial and temporal evolution of the plume since its eruption is still highly … Read more…
Extension velocities along Pangea’s Triassic-Cenozoic rift systems. Each circle depicts the rift velocity of one passive margin point in terms of circle colour and size. Visit the interactive virtual rift globe here.
Extension velocities along Pangea’s Triassic-Cenozoic rift systems. Each circle depicts the rift velocity of one passive margin point in terms of circle colour and size. Visit the interactive virtual rift globe here.
Reconstructions of absolute plate velocities, with colours and vector lengths indicating plate speed and vector azimuths representing absolute plate motion directions. Subduction zones are coloured magenta teethed lines that indicate subduction polarity, mid-ocean ridges are black lines and coastlines and boundaries between continental blocks and terranes are shown as grey lines. Hammer projection with 30°W … Read more…
In this numerical model of landscape evolution we impose over 2 million of years deformation produced with the Underworld software over an initial flat surface, ie a 256 km square box at a resolution of 1 km. On top of the deformed surface, a landscape evolution model, Badlands, is used to simulate both hillslope and … Read more…
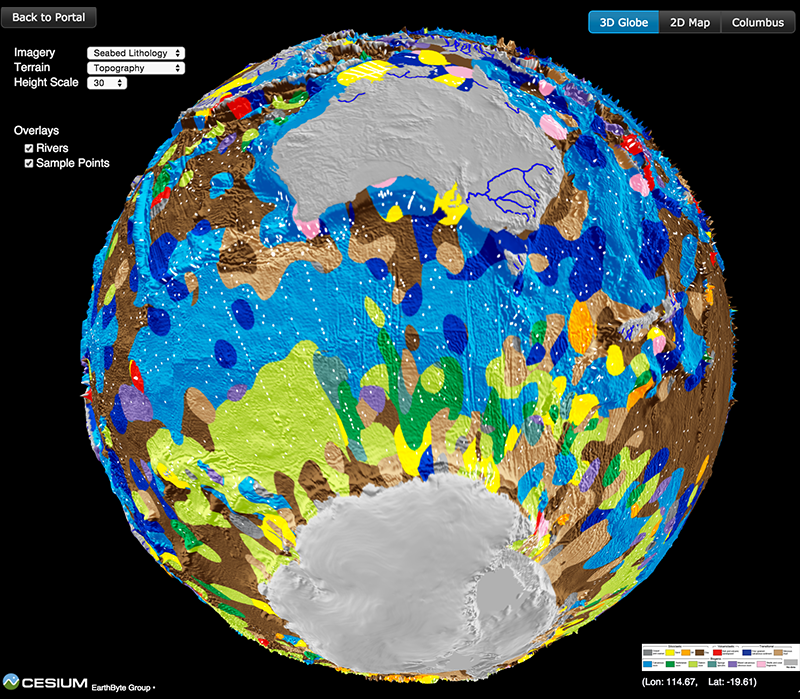
This spinning virtual seafloor geology globe is composed of a set of screen captures of an interactive digital globe portraying the distribution of different seafloor sediments available at the Gplates Portal.Citation Dutkiewicz, A., Müller, R. D., O’Callaghan, S., & Jónasson, H. (2015). Census of seafloor sediments in the world’s ocean. Geology, G36883-1. doi: 10.1130/G36883.1.Download paper … Read more…
This spinning virtual seafloor geology globe is composed of a set of screen captures of an interactive digital globe portraying the distribution of different seafloor sediments available at the Gplates Portal.Citation Dutkiewicz, A., Müller, R. D., O’Callaghan, S., & Jónasson, H. (2015). Census of seafloor sediments in the world’s ocean. Geology, G36883-1. doi: 10.1130/G36883.1.Download paper … Read more…
Citation Heine, C., Müller, R. D., Steinberger, B. and DiCaprio, L., 2010, Integrating deep Earth dynamics in paleogeographic reconstructions of Australia, Tectonophysics, 483, 135-150. View other EarthByte animations on our YouTube channel
A global animation accompanying the publication Global continental and ocean basin reconstructions since 200 Ma.Citation Seton, M., et al. (2012), Global continental and ocean basin reconstructions since 200 Ma, Earth-Science Reviews, 113(3-4), 212-270. doi: 10.1016/j.earscirev.2012.03.002.View the full playlist on our EarthByte YouTube channel
Reconstructions of tectonic plates and oceanic paleodepth (i.e. paleobathymetry).Citation Müller, R., M. Sdrolias, C. Gaina, and W. Roest (2008). Age, spreading rates, and spreading asymmetry of the world’s ocean crust, Geochemistry, Geophysics, Geosystems, 9(4), 19, Q04006. doi: 10.1029/2007GC001743.View the full playlist on our EarthByte YouTube channel
Courtesy of Prof Louis Moresi, created with the ellipsis software.Citation O’Neill, C., Moresi, L., Müller, R.D., Albert, R. and Dufour, F., 2006, Ellipsis 3D: a particle-in-cell finite element hybrid code for modelling mantle convection and lithospheric deformation, Computers and Geosciences, 32, 1769-1779.View other EarthByte animations on our YouTube channel
Citation Gurnis, M., R. D. Müller, and L. Moresi (1998), Cretaceous vertical motion of Australia and the Australian Antarctic discordance, Science, 279(5356), 1499-1504.View other EarthByte animations on our YouTube channel
Citation Hassan, R., N. Flament, M. Gurnis, D. J. Bower, and D. Müller (2015), Provenance of plumes in global convection models, Geochemistry, Geophysics, Geosystems.View other EarthByte animations on our YouTube channel
This animation portrays the motion of continents (grey, yellow, orange and red) and oceanic plates (blue) since Pangea breakup from 200 million years ago. The model is a modified version of the Seton et al.Citation Zahirovic, S., R. Müller, M. Seton, and N. Flament (2015), Tectonic speed limits from plate kinematic reconstructions, Earth and Planetary … Read more…
