Global plate boundary evolution and kinematics since the late Paleozoic

Matthews++_SummaryFigCitation

Matthews, K.J., Maloney, K.T., Zahirovic, S., Williams, S.E., Seton, M., and Müller, R.D. (2016). Global plate boundary evolution and kinematics since the late Paleozoic, Global and Planetary Change, 146, 226-250. DOI: 10.1016/j.gloplacha.2016.10.002

Abstract

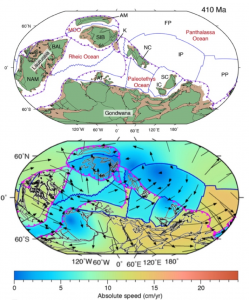
Many aspects of deep-time Earth System models, including mantle convection, paleoclimatology, paleobiogeography and the deep Earth carbon cycle, require high-resolution plate models that include the evolution of the mosaic of plate boundaries through time. We present the first continuous late Paleozoic to present-day global plate model with evolving plate boundaries, building on and extending two previously published models for the late Paleozoic (410–250 Ma) and Mesozoic-Cenozoic (230–0 Ma). We ensure continuity during the 250–230 Ma transition period between the two models, update the absolute reference frame of the Mesozoic-Cenozoic model and add a new Paleozoic reconstruction for the Baltica-derived Alexander Terrane, now accreted to western North America. This 410–0 Ma open access model provides a framework for deep-time whole Earth modelling and acts as a base for future extensions and refinement.

This model is available with a default mantle reference frame, a hybrid reference frame using moving hotspots and a true polar wander corrected paleomagnetic reference frame (see paper for details) as well as with a paleomagnetic reference frame. For times before 83 Ma, the Pacific is shifted to maintain relative motions with the circum-Pangea continents – largely due to the fact that no paleomagnetic reference frames exist that extend to the birth age of the Pacific Plate. The paleomagnetic reference frame is based on data from Torsvik, T. H., Van der Voo, R., Preeden, U., Mac Niocaill, C., Steinberger, B., Doubrovine, P. V., van Hinsbergen, D. J., Domeier, M., Gaina, C., and Tohver, E., 2012, Phanerozoic polar wander, palaeogeography and dynamics: Earth-Science Reviews, v. 114, no. 3, p. 325-368, DOI: 10.1016/j.earscirev.2012.06.007.

Read more…

Share

GPlates 2.0 software and data sets

GPlates 1.5 PromoGPlates is a free desktop software for the interactive visualisation of plate-tectonics. The compilation and documentation of GPlates 2.0 data was primarily funded by AuScope National Collaborative Research Infrastructure (NCRIS).

GPlates is developed by an international team of scientists and professional software developers at the EarthByte Project (part of AuScope) at the University of Sydney, the Division of Geological and Planetary Sciences (GPS) at CalTech, the Geodynamics team at the Geological Survey of Norway (NGU) and the Centre for Earth Evolution and Dynamics (CEED) at the University of Oslo.  … Read more…

Share

SoftwareX – Badlands: A parallel basin and landscape dynamics model

Abstract: Over more than three decades, a number of numerical landscape evolution models (LEMs) have been developed to study the combined effects of climate, sea-level, tectonics and sediments on Earth surface dynamics. Most of them are written in efficient programming languages, but often cannot be used on parallel architectures. Here, I present a LEM which … Read more…

Surface Processes Modelling Workshop

Badlands imageThe EarthByte Group will conduct a 2 days workshop on surface processes modelling on the 13th and 14th of October in the Madsen Building at the School of Geoscience, The University of Sydney, Australia.

The workshop aims to introduce those interested in landscape evolution and source to sink problems to a new open-source code: Badlands. Note that you do not have to be a seasoned modeller to participate. Geomorphologists, tectonicists and sedimentologists interested in testing conceptual models based on field observations are welcome!Read more…

Share

Large fluctuations of shallow seas in low-lying Southeast Asia driven by mantle flow

Author List: Sabin Zahirovic, Nicolas Flament, Dietmar Müller, Maria Seton, Mike Gurnis. Citation: Zahirovic, S., Flament, N., Müller, R.D., Seton, M., and Gurnis, M. (2016). Large fluctuations of shallow seas in low-lying Southeast Asia driven by mantle flow. Geochemistry, Geophysics, Geosystems. doi:10.1002/2016GC006434 The Sundaland continental promontory, as the core of Southeast Asia, is one of the lowest lying … Read more…

Subduction zone lengths: A modelled reality?

In order to see how well the Matthews et al. (2016) plate kinematic model (Figure 2) can be relied upon to represent subduction zone length variations through time, we measured plate boundaries from the Bird (2003) global plate boundary data set (Figure 1). This was achieved using a combination of ArcGIS and our subduction zone analysis tools. … Read more…

Setting up environment for DCO Demo Analysis

Mac Environment 1.1) Install Anaconda Navigate to the continuum website and download the python 2.7 Mac version of Anaconda, if not already installed. In terminal, where the downloaded anaconda source code is stored, type: bash Anaconda2-4.1.1-MacOSX-x86_64.sh Select yes to all of the prompts. Edit your .bash_profile to include the anaconda bin path in the PATH … Read more…

Deep Carbon Modelling Workshop

Date:  August 29 – 30 2016 Venue: The University of Sydney Description: A two-day workshop bringing together climate and geo-scientists from around Sydney and international collaborators on the DCO-funded Deep Carbon Modelling project. Deep carbon science describes the multi-disciplinary effort to unravel the dynamic interactions of carbon-bearing systems in deep time. The workshop will focus on exploring the interplays … Read more…

Taking the pulse of the global ocean

sediments_currents_global_oceanWhen organic particles sink from the surface ocean to the seafloor, a small but significant proportion of atmospheric carbon is stored away. Adriana Dutkiewicz and colleagues at the University of Sydney and Data61/CSIRO have now used global data sets collected over decades combined with cutting-edge big data analysis to understand how this process depends on surface ocean environments.   … Read more…

Share

Controls on the distribution of deep-sea sediments

Author List: Dr Adriana Dutkiewicz, Dr Simon O’Callaghan, Prof Dietmar Müller Citation: Dutkiewicz, A., O’Callaghan, S., and Müller, R.D. (2016). Controls on the distribution of deep-sea sediments. Geochemistry, Geophysics, Geosystems 17 1–24. doi:10.1002/2016GC006428 Abstract: Deep-sea sediments represent the largest geological deposit on Earth and provide a record of our planet’s response to conditions at the sea surface from … Read more…

Commotion in the deep Southern Ocean

souther_ocean_circulationCongratulations Adriana Dutkiewicz, Dietmar Müller, Andrew Hogg, and Paul Spence for their recent paper published in Geology. Their paper, Vigorous deep-sea currents cause global anomaly in sediment accumulation in the Southern Ocean, revealed an enormous stretch of the Southern Ocean where sediments are building up at a rate that dwarfs other deep ocean locations. The work has attracted the attention of media internationally. … Read more…

Share

Vigorous deep-sea currents cause global anomaly in sediment accumulation in the Southern Ocean

Author List:  Adriana Dutkiewicz, Dietmar Müller, Andy Hogg and Paul Spence. Citation: Dutkiewicz, A., Müller, R. D., Hogg, A. M. & Spence, P. (2016). Vigorous deep-sea currents cause global anomaly in sediment accumulation in the Southern Ocean. Geology, 44(8), 663–666. doi:10.1130/G38143.1 Abstract: The vigorous current systems in the Southern Ocean play a key role in regulating the Earth’s … Read more…

Commotion in the deep Southern Ocean

SE_Ind_ridge_labelled
Bathymetry of the Southeast indian Ridge, where a major sediment accumulation rate anomaly has been linked to lateral changes in the vigour of bottom water flow.

A team led by the University of Sydney School of Geosciences has found an 8,000-km long sediment pile-up in the middle of the Southern Ocean, making this feature unique in the world. Their study was published today in the leading international journal Geology. … Read more…

Share

Abrupt plate accelerations shape rifted continental margins

Author List: Sascha Brune, Simon Williams, Nathaniel Butterworth and Dietmar Müller. Citation: Brune, S., Williams, S.E, Butterworth, N. P., and Müller, R.D. (2016). Abrupt plate accelerations shape rifted continental margins. Nature, 1–4. doi:10.1038/nature18319 Abstract: Rifted margins are formed by persistent stretching of continental lithosphere until breakup is achieved. It is well known that strain-rate-dependent processes control rift evolution, yet quantified extension … Read more…

The pains and strains of a continental breakup in the media

West_Australian_margin.jpg
View of Australia’s western continental margin, looking eastwards from the Indian Ocean.

Congratulations to Dr Sascha Brune, Dr Simon Williams, Dr Nathan Butterworth, and Prof Dietmar Müller on their paper published in Nature earlier this week. The paper,  Abrupt plate accelerations shape rifted continental marginshas been picked up by the media across the globe.

... Read more...

Share

The pains and strains of a continental breakup

Every now and then in Earth’s history, a pair of continents draws close enough to form one. There comes a time, however, when they must inevitably part ways. Now scientists at Australia’s EarthByte research group, in collaboration with the German Research Centre for Geosciences, have revealed the underlying mechanics of a continental breakup when this … Read more…

Dietmar Müller finalist for AuScope Excellence in Research Award

Recently the Australian geoscience community celebrated a decade of AuScope achievements. EarthByte’s very own Prof Dietmar Muller was an award finalist for excellence in scientific research and providing tools (such as GPlates) that enable scientific development in our community. GPlates is an open-source and cross-platform tool that is accessible to high school teachers, research scientists and anyone … Read more…

Calculating arc-trench distances using the Smithsonian Global Volcanism Project database

Figure 1. Using ArcMap to visualise and calculate the distances between volcano locations (data points, yellow triangles) and subduction zones (black polylines).   Based on a study of 20 selected segments of arc-trench systems, Dickson (1973) found that the distance between trench axes to magmatic arc axes (or volcanic front) ranged from between 100 to 300 km … Read more…