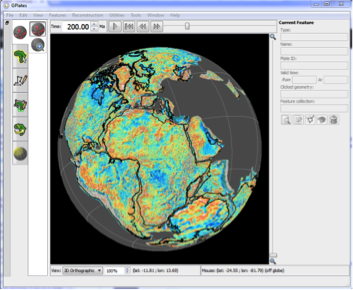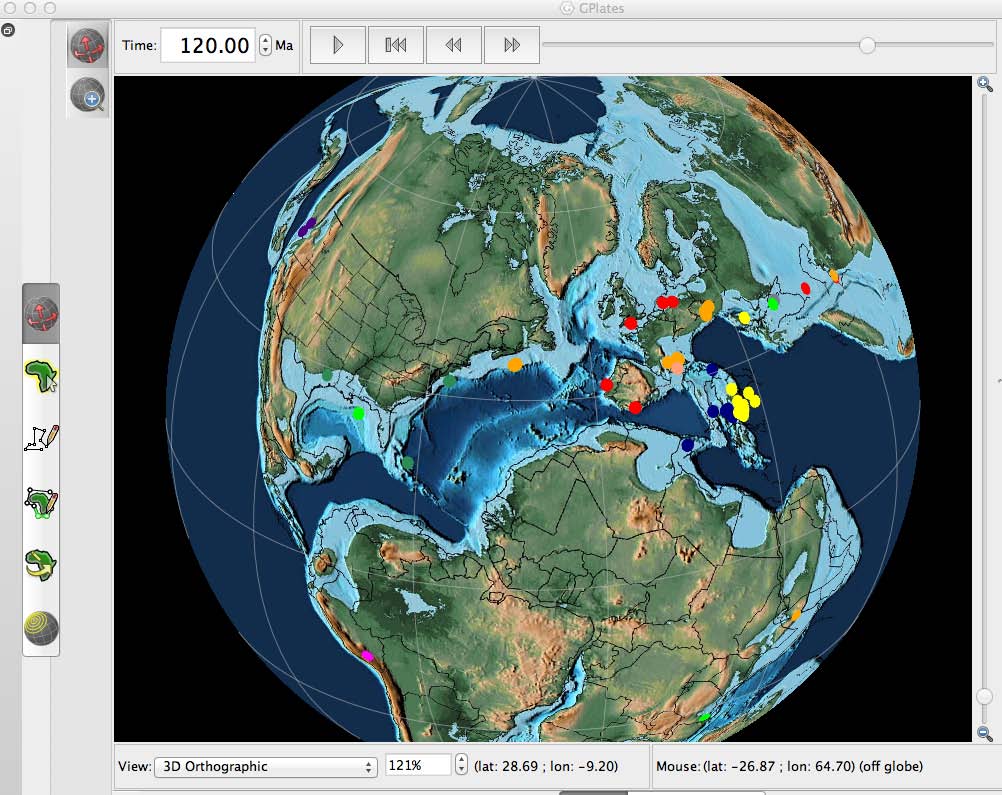
A Paleomagnetic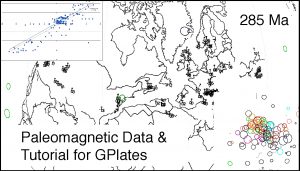 Database that has been assembled for use with the program, GPlates. The paleomagnetic database presented here is made up of 1638 paleopoles compiled by Rob Van der Voo for his book, Paleomagnetism of the Atlantic, Tethys, and Iapetus Oceans. In addition to the spreadsheet of paleopoles, we have constructed five feature collections that can be used to visualize the paleomagnetic data using GPlates: 1) site localities, 2) paleopoles, 3) declination arrows, 4) paleolatitude labels, and a set of time-dependent rasters which plot the site locations, paleopoles, declination arrows, and paleolatitude labels on a set of plate tectonic reconstructions ( 0 – 540 Ma). The last section of this report is a detailed discussion of the paleomagnetic data for three-time intervals (40Ma, 285Ma, and 450Ma). The Supplementary Materials includes a program, “PaleoPolePlotter”, which GPlates users can use to build paleopoles, declination arrows, and paleolatitude labels from user-defined data sets
… Read more…
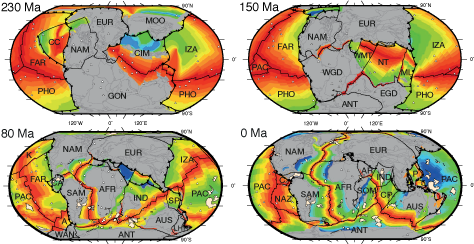
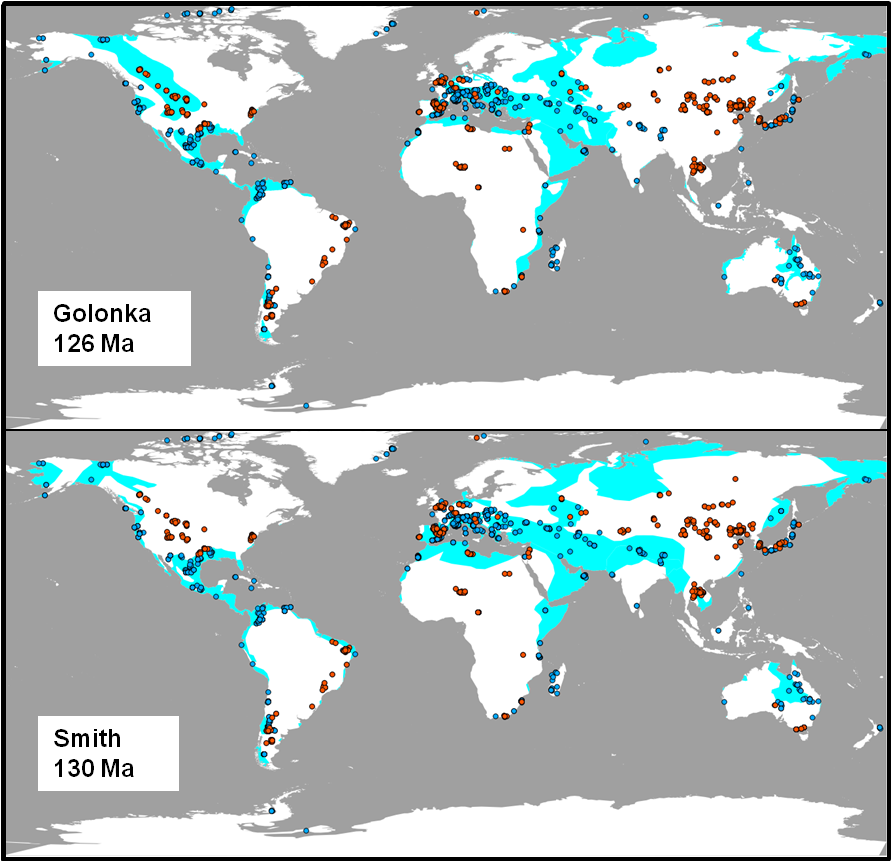
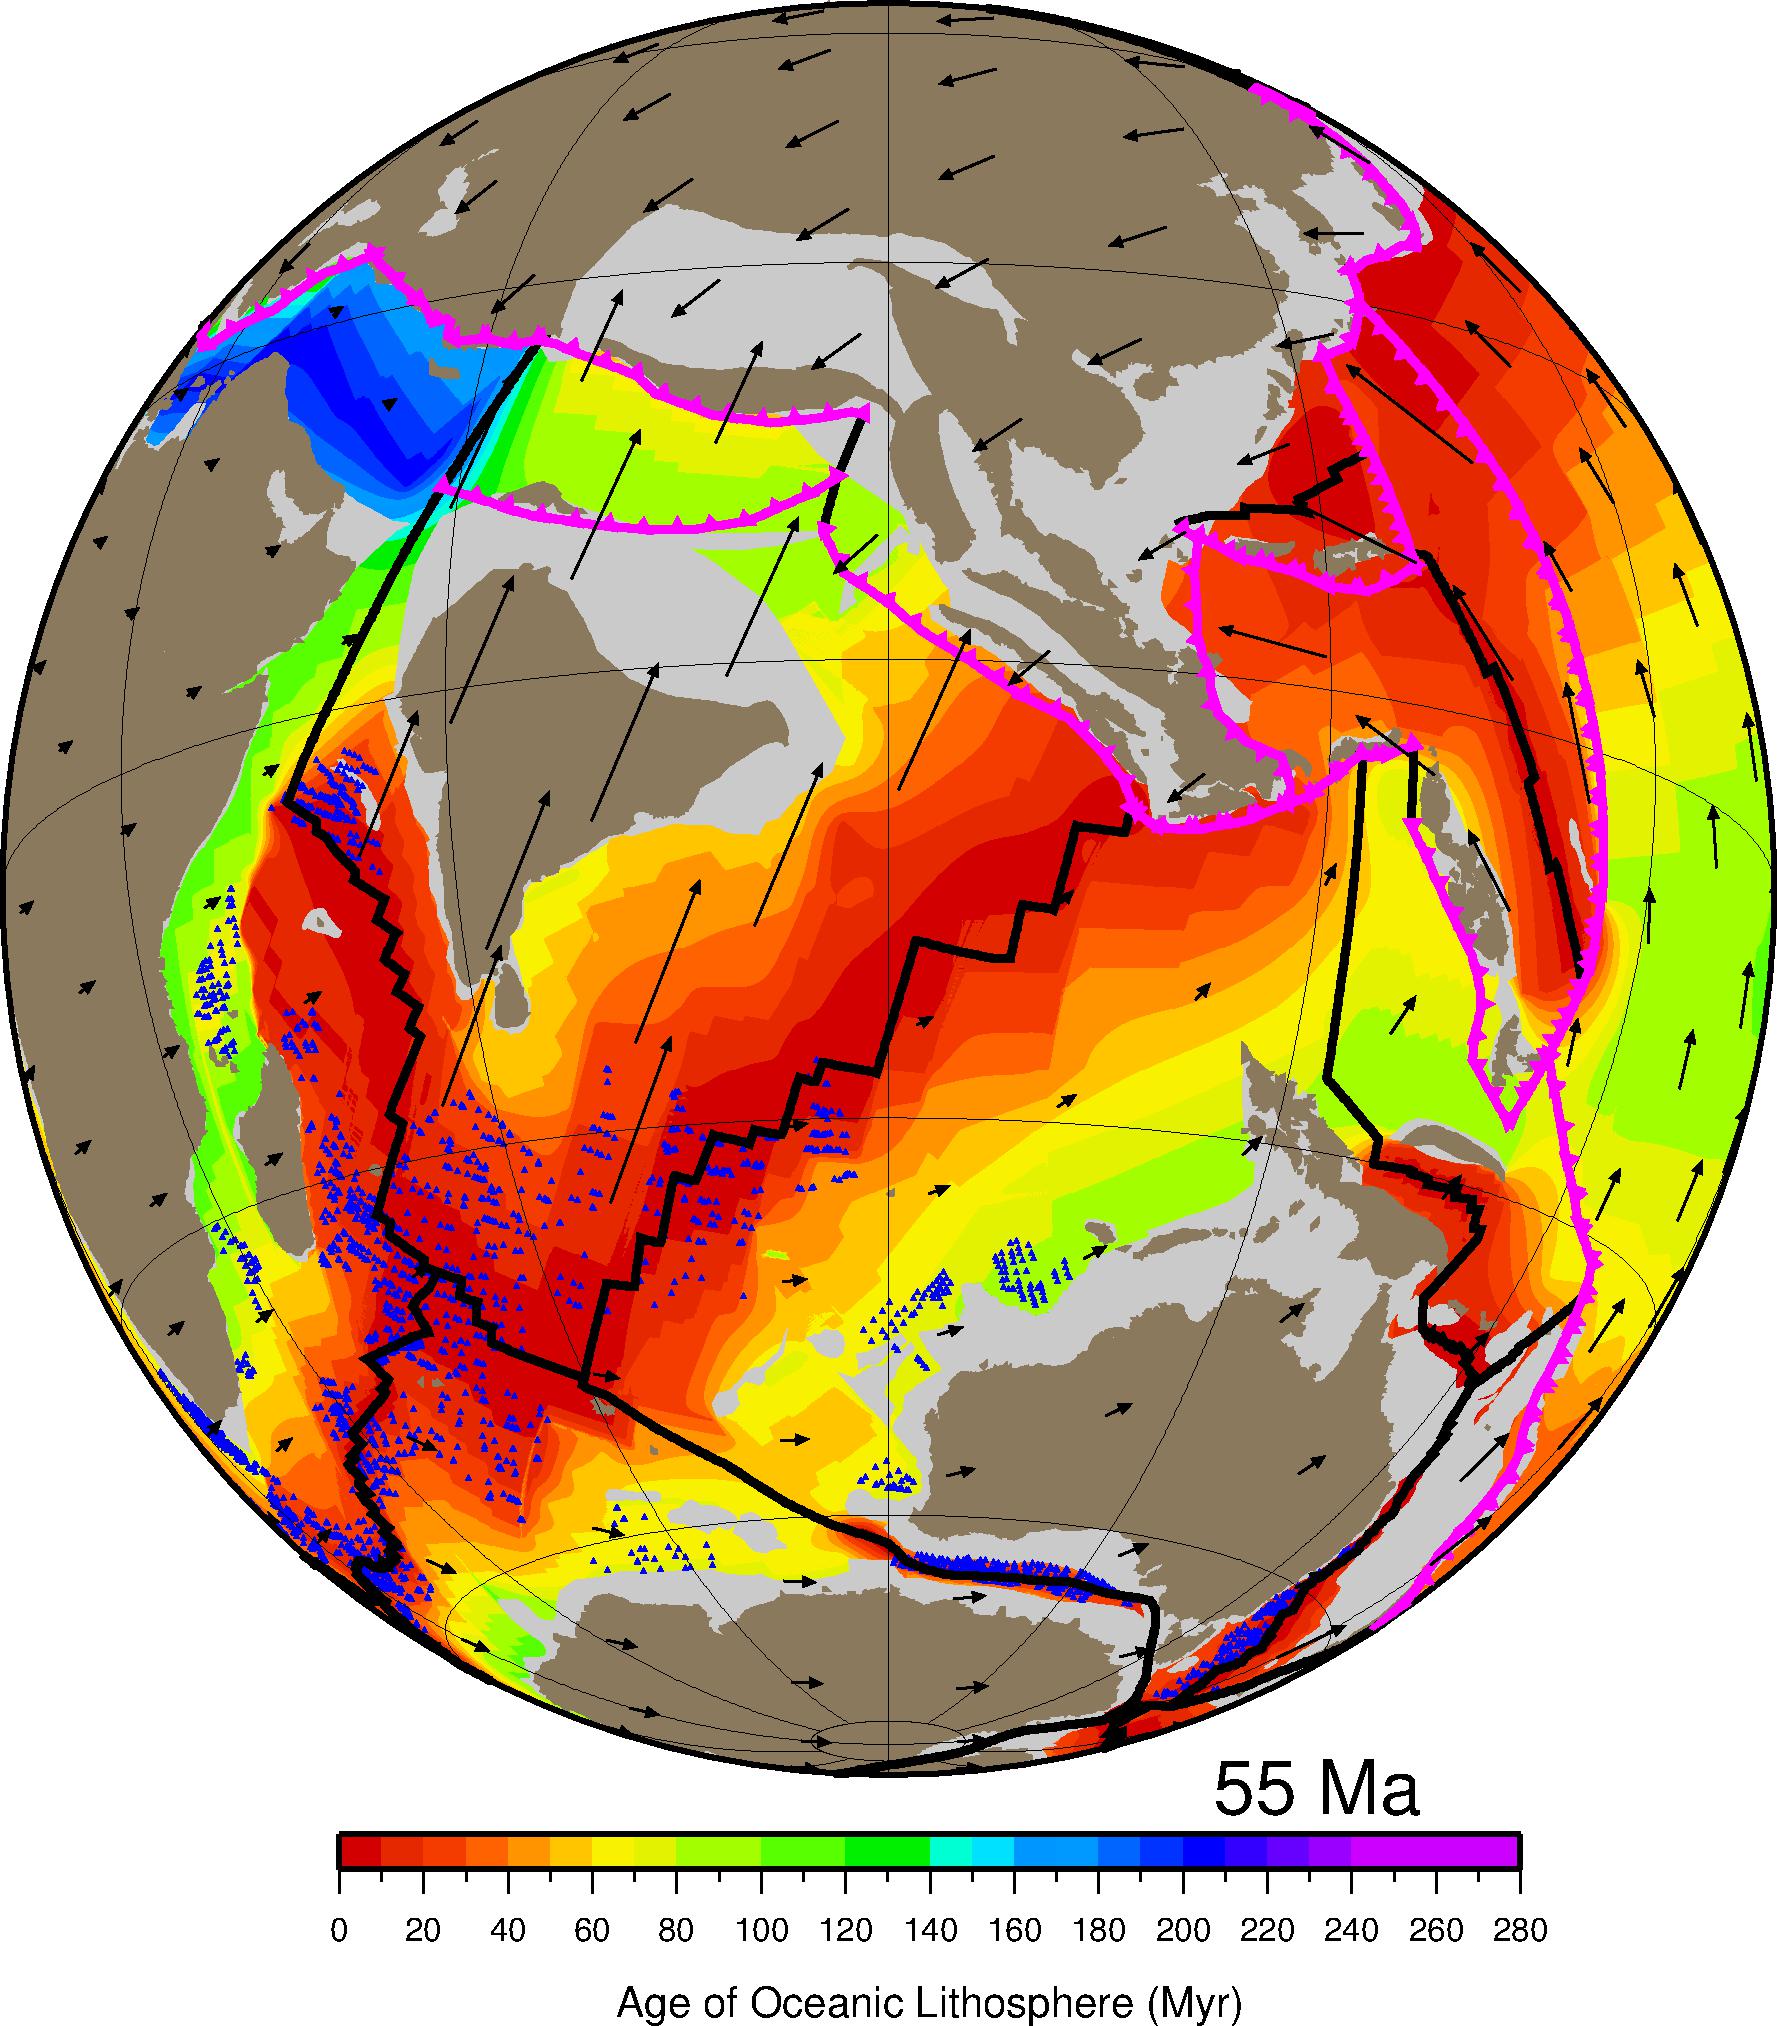
Improving global paleogeography since the late Paleozoic using paleobiology
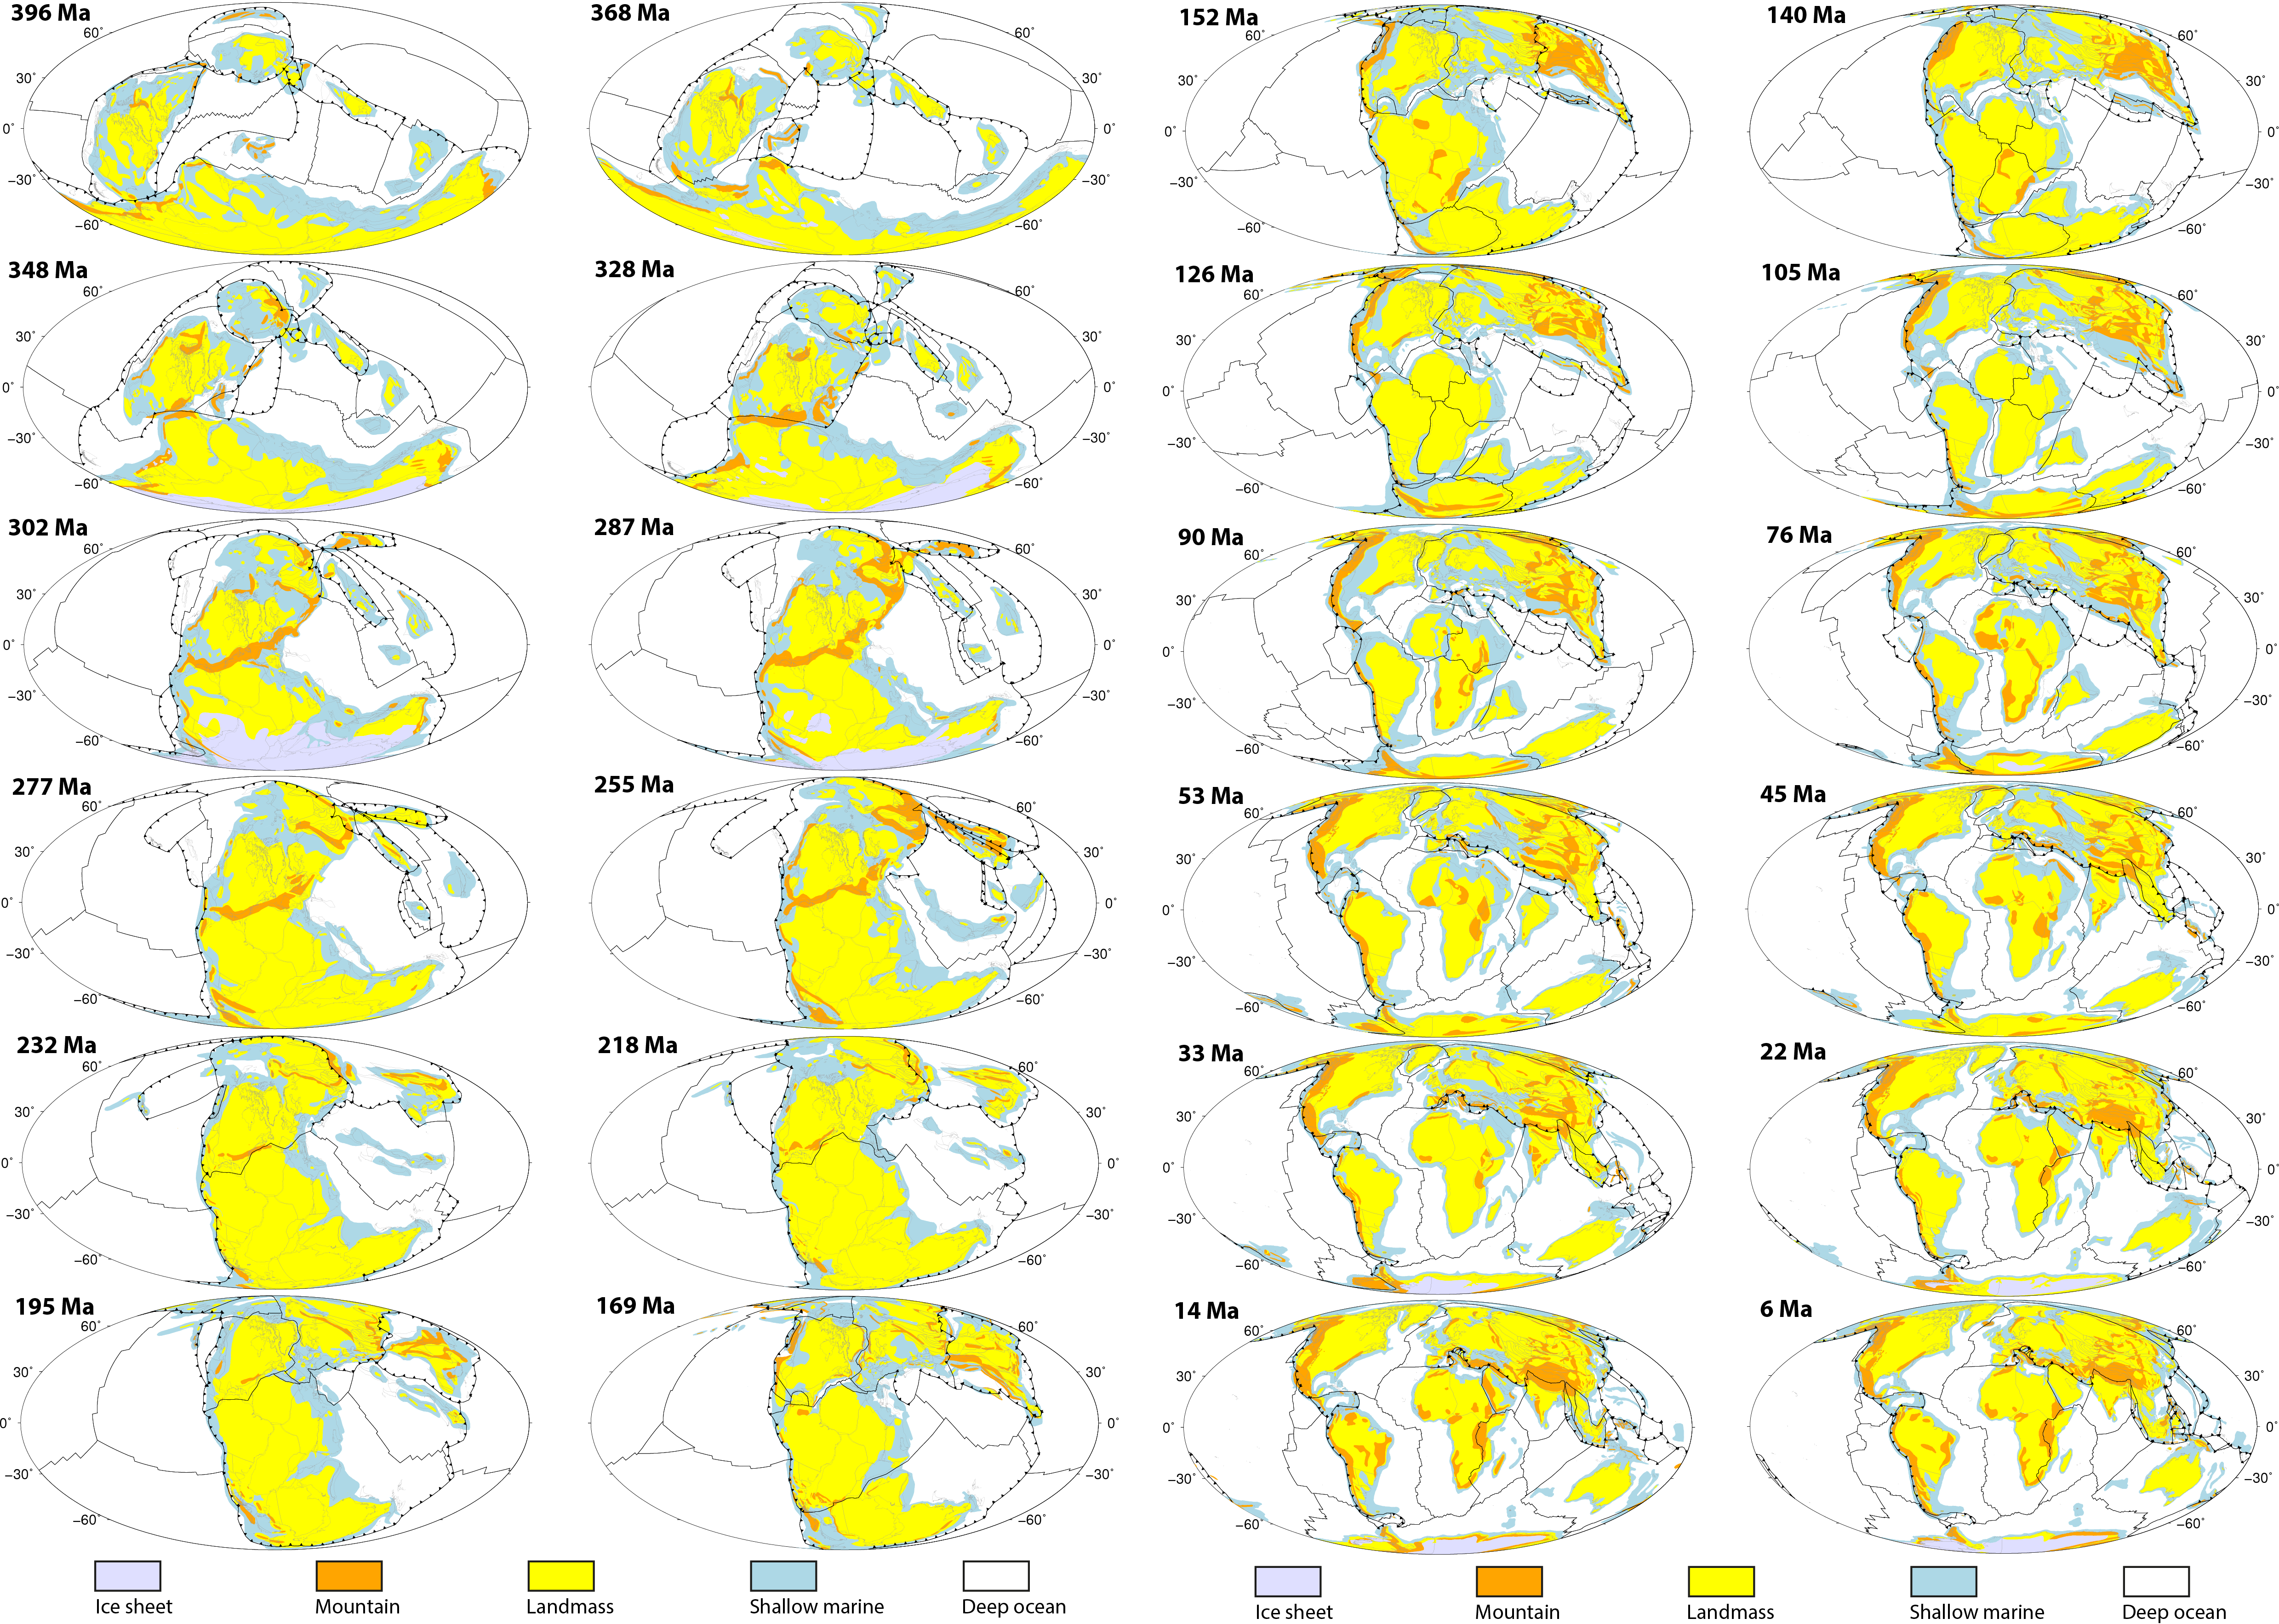
Author List: Wenchao Cao, Sabin Zahirovic, Nicolas Flament, Simon Williams, Jan Golonka, Dietmar Müller Citation: Cao, W., Zahirovic, S., Flament, N., Williams, S., Golonka, J., and Müller, R. D., 2017, Improving global paleogeography since the late Paleozoic using paleobiology: Biogeosciences, v. 14, no. 23, p. 5425-5439. Paleogeographic maps, linked to plate tectonic reconstructions, are key components required for climate models … Read more…