
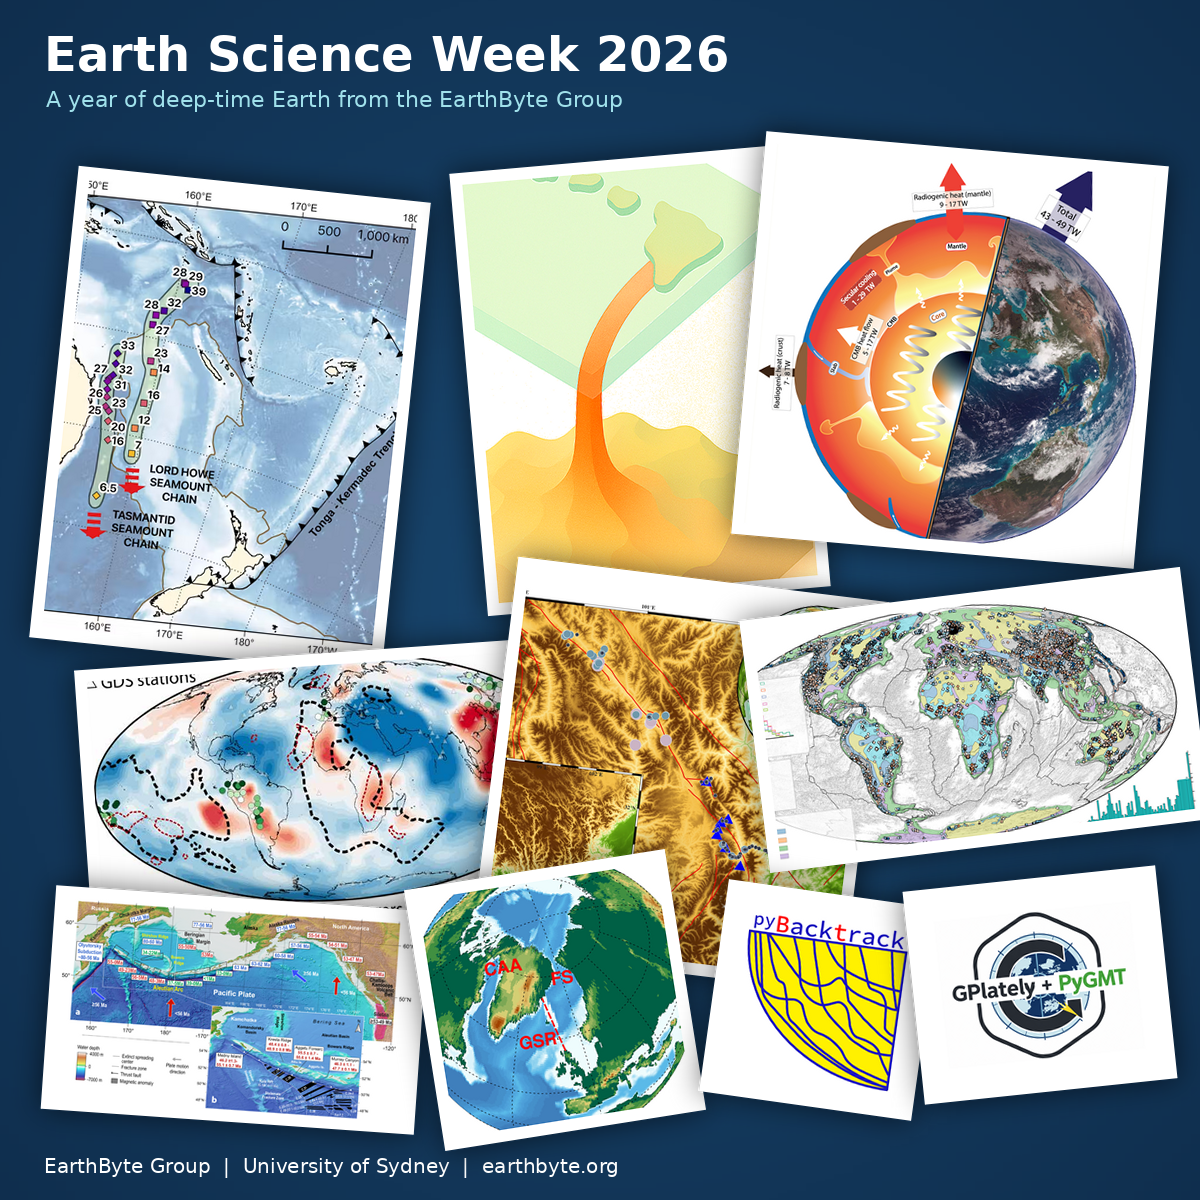
Happy Earth Science Week from the EarthByters! This is our annual chance to celebrate the science of the planet we all live on, and to share how much there is still to discover about it.
The ground under your feet is moving. Right now, at about the speed your fingernails grow, and it has been doing so for billions of years.
Earth science asks how a planet works when most of it is out of sight. The Tasman Sea has two parallel chains of volcanoes, and they trace a plume of hot mantle being split by a sinking slab. In the warm Miocene, the shape of the ocean gateways, such as the Fram Strait and the Greenland-Scotland Ridge, influenced how the ocean overturned and moved heat around the planet. The core loses heat to the mantle at a rate that has changed over 1.8 billion years, and that rate influences how hot mantle plumes are. A plateau as large as Tibet grows eastward as the crust beneath it deforms.
These stories connect because the deep Earth and the surface are one system. Over geological time, plate motions have rearranged the oceans, raised mountains, concentrated metals into ore deposits and shifted the climate. To follow that, you need the planet’s past positions, which means rebuilding plate motions, continents and ocean basins back through hundreds of millions of years, then testing those reconstructions against rocks, seafloor, gravity and seismic data.
To put that within everyone’s reach, we have released 80 new open tutorials that connect plate tectonics and palaeogeography to map making and data analysis. They link GPlately with PyGMT, so you can reconstruct a past Earth, plot it as a publication-quality map and analyse your own data against it, all in one open workflow. Whether you are a student drawing your first map or a researcher testing a new idea, you can start today. GPlately-pyGMT tutorials.

